今回は「ITエンジニアのための機械学習理論入門」の最尤推定による回帰分析のサンプルコードを ruby で実装してみます。書籍のサンプルコードは下記に公開されています。
自然対数
今回は前回までのコードと似ている部分が多く、新しい要素は自然対数のみで、python では自然対数を求めるために numpy.log を使います。
numpy.log
https://docs.scipy.org/doc/numpy/reference/generated/numpy.log.html
ruby では Math.log メソッドを使います。
Math.log
https://docs.ruby-lang.org/ja/latest/method/Math/m/log.html
サンプルスクリプト全体
ruby でのコード全体としては下記のように実装しました。
require 'daru'
require 'nyaplot'

N = 10
M = [0, 1, 3, 9]

def normal_rand(mu = 0, sigma = 1.0)
  random = Random.new
  (Math.sqrt(-2 * Math.log(random.rand)) * Math.sin(2 * Math::PI * random.rand) * sigma) + mu
end


def create_dataset(num)
  dataset = Daru::DataFrame.new({'x': [], 'y': []})

  num.times do |i|
    x = i.to_f / (num - 1).to_f
    y = Math.sin(2 * Math::PI * x) + normal_rand(0, 0.3)
    dataset.add_row(Daru::Vector.new([x, y], index: [:x, :y]))
  end

  return dataset
end

def log_likelihood(dataset, f)
  dev = 0.0
  n = dataset.size.to_f
  dataset.each_row do |line|
    x = line.x
    y = line.y
    dev += (y - f.call(x))**2
  end
  err = dev * 0.5
  beta = n / dev
  -beta * err + 0.5 * n * Math.log(0.5 * beta / Math::PI)
end

def resolve(dataset, m)
  t = dataset.y

  columns = {}
  (m+1).times do |i|
    columns["x**#{i}"] = dataset.x ** i
  end
  phi = Daru::DataFrame.new(columns)

  tmp = (phi.transpose.to_matrix * phi.to_matrix).inv
  ws = (tmp * phi.transpose.to_matrix) * Vector.elements(t.to_a)

  f = lambda {|x|
    y = 0
    ws.each_with_index do |w, i|
      y += w * (x ** i)
    end

    y
  }

  sigma2 = 0.0
  dataset.each_row do |line|
    sigma2 += (f.call(line.x) - line.y)**2
  end
  sigma2 /= dataset.size

  return f, ws, Math.sqrt(sigma2)
end

train_set = create_dataset(N)
test_set = create_dataset(N)
df_ws = {}

fig = Nyaplot::Frame.new

M.each_with_index do |m, c|
  f, ws, sigma = resolve(train_set, m)
  df_ws["M=#{m}"] = Daru::Vector.new(ws, name: "M=#{m}")

  plot = Nyaplot::Plot.new
  sc = plot.add_with_df(train_set.to_nyaplotdf, :scatter, :x, :y)
  sc.title("train_set")
  sc.color('blue')

  linex = (0..1).step(1.0 / (101 - 1)).to_a
  liney = linex.map do |x|
    Math.sin(2 * Math::PI * x)
  end
  line_answer = plot.add(:line, linex, liney)
  line_answer.title('answer')
  line_answer.color('green')

  liney = linex.map do |x|
    f.call(x)
  end
  line_middle = plot.add(:line, linex, liney)
  line_middle.title("Sigma=#{sprintf("%.2f", sigma)}")
  line_middle.color('red')
  line_upper = plot.add(:line, linex, liney.map {|y| y + sigma })
  line_upper.color('red')
  line_lower = plot.add(:line, linex, liney.map {|y| y - sigma } )
  line_lower.color('red')

  plot.configure do
    x_label("M=#{m}")
    y_label('')
    xrange([-0.05, 1.05])
    yrange([-1.5, 1.5])
    legend(true)
    height(300)
    width(490)
  end

  fig.add(plot)
end

fig.show

df = Daru::DataFrame.new({m: [], 'Test set': [], 'Training set': []})
9.times do |m|
  f, ws, sigma = resolve(train_set, m)
  train_mlh = log_likelihood(train_set, f)
  test_mlh = log_likelihood(test_set, f)
  df.add_row(Daru::Vector.new([m, test_mlh, train_mlh], index: [:m, 'Test set'.to_sym, 'Training set'.to_sym]))
end

df.plot(type: [:line, :line], x: [:m, :m], y: ['Test set'.to_sym, 'Training set'.to_sym]) do |plot, diagrams|
  test_set_diagram = diagrams[0]
  train_set_diagram = diagrams[1]

  train_set_diagram.title('Training set')
  train_set_diagram.color('blue')
  test_set_diagram.title('Test set')
  test_set_diagram.color('green')

  plot.x_label("Log likelihood for N=#{N}")
  plot.y_label('')
  plot.legend(true)
end
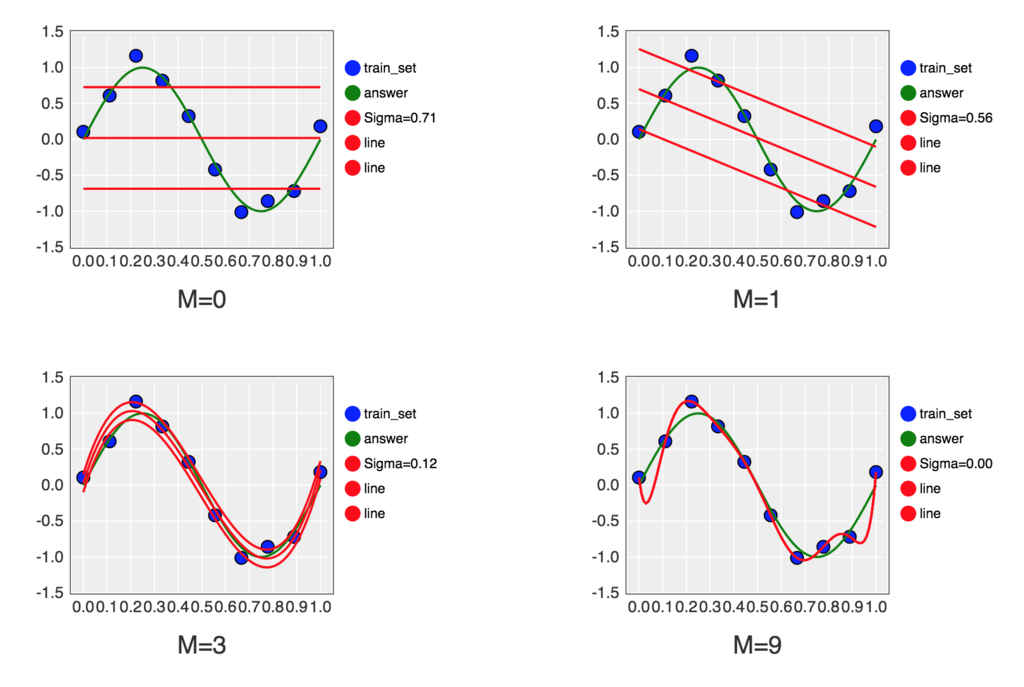
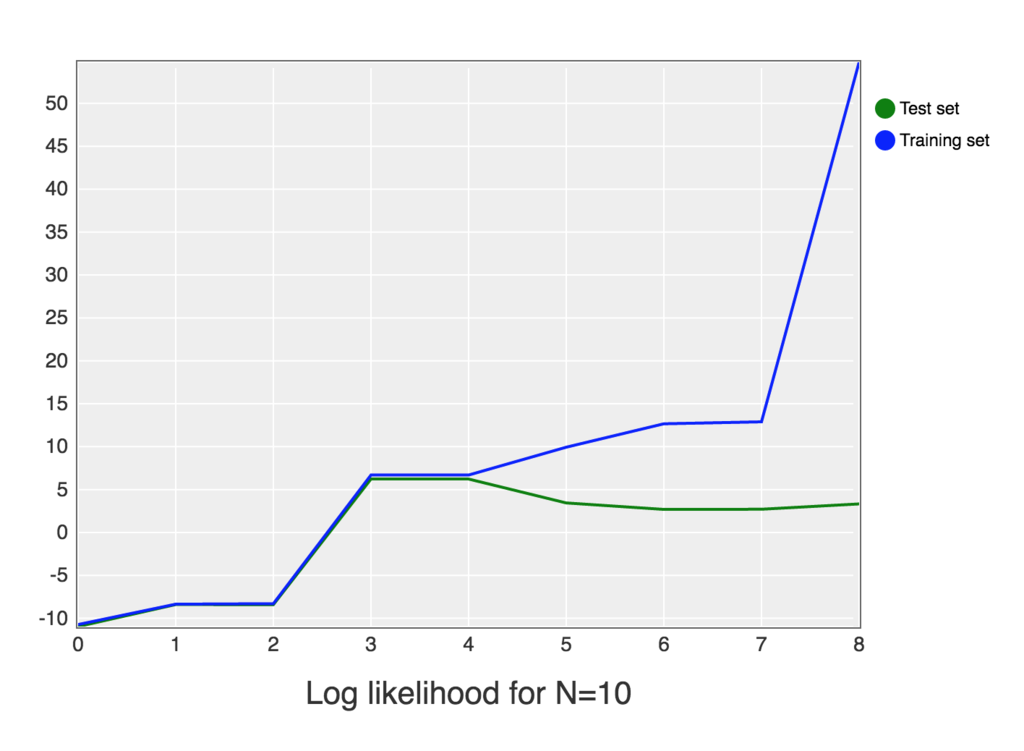
これを jupyter notebook 上で実行すると下記のようなグラフが描画されます。


Jupyter Notebook 上での実行結果は下記に公開してあります。
http://nbviewer.jupyter.org/github/h-akanuma/ml4se_study/blob/master/03-maximum_likelihood.ipynb