今回は下記書籍のロジスティック回帰のROC曲線のコードを Ruby で実装してみたいと思います。
ITエンジニアのための機械学習理論入門
サンプルコードはこちらで公開されています。
データセットの更新
Python版では計算結果の確率をデータセットに反映する際に、下記のように pandas.DataFrame.ix メソッドを使って対象を特定し、値を代入しています。
p = 1.0/(1.0+np.exp(-a))
training_set.ix[index, 'probability'] = p
pandas.DataFrame.ix — pandas 0.19.2 documentation
Ruby版ではデータの取り出しと代入を一度では行えなさそうだったので、 Daru::DataFrame#row で Vector オブジェクトを取得し、値を更新した上で Daru::DataFrame#set_row_at で更新するやり方にしてみました。
p = 1.0 / (1.0 + Math.exp(-a))
v = train_set.row[index]
v[:probability] = p
train_set.set_row_at([index], v)
Method: Daru::DataFrame#row — Documentation for daru (0.1.4.1)
Method: Daru::DataFrame#set_row_at — Documentation for daru (0.1.4.1)
データセットのソート
Python版では pandas.DataFrame.sort_values メソッドを使ってデータセットを確率の高い順にソートしています。
result = training_set.sort_values(by=['probability'], ascending=[False])
pandas.DataFrame.sort_values — pandas 0.19.2 documentation
Ruby版では Daru::DataFrame#sort メソッドを使ってソートしました。
sorted_train_set = train_set.sort([:probability], ascending: false)
Method: Daru::DataFrame#sort — Documentation for daru (0.1.4.1)
Class: Daru::DataFrame — Documentation for daru (0.1.4.1)
Indexの振り直し
Python版ではソート後のデータセットのインデックスを pandas.DataFrame.reset_index メソッドで振り直しています。
return result.reset_index()
pandas.DataFrame.reset_index — pandas 0.19.2 documentation
Ruby版では単純にインデックスを振り直すやり方がみつからなかったので、Indexに入れる値を別の列のデータとして追加した後、 Daru::DataFrame#reindex でその列をインデックスとして使うように変更しました。
Method: Daru::DataFrame#set_index — Documentation for daru (0.1.4.1)
sorted_train_set[:index] = sorted_train_set.size.times.to_a
sorted_train_set.set_index(:index)
スクリプト全体
上記以外のデータセットの用意やロジスティック回帰の実施部分などは前回とほぼ同じです。ここまでの内容を踏まえて、コード全体としては下記のように実装しました。
# ロジスティック回帰のROC曲線

require 'daru'
require 'nyaplot'
require 'numo/narray'

Variances = [50, 150] # 両クラス共通の分散(2種類の分散で計算を実施)

def normal_rand(mu = 0, sigma = 1.0)
  random = Random.new
  (Math.sqrt(-2 * Math.log(random.rand)) * Math.sin(2 * Math::PI * random.rand) * sigma) + mu
end

# データセット {x_n,y_n,type_n} を用意
def prepare_dataset(variance)
  n1 = 80
  n2 = 200
  mu1 = [9, 9]
  mu2 = [-3, -3]

  sigma = Math.sqrt(variance)

  df1 = n1.times.map do
    [normal_rand(mu1[0], sigma), normal_rand(mu1[1], sigma)]
  end
  df1 = df1.transpose
  df1 = Daru::DataFrame.new(x: df1[0], y: df1[1], type: Array.new(n1).fill(1))

  df2 = n2.times.map do
    [normal_rand(mu2[0], sigma), normal_rand(mu2[1], sigma)]
  end
  df2 = df2.transpose
  df2 = Daru::DataFrame.new(x: df2[0], y: df2[1], type: Array.new(n2).fill(0))

  df = df1.concat(df2)
  df = df.reindex(Daru::Index.new(df.index.to_a.shuffle))
  df[:index] = (n1 + n2).times.to_a
  df.set_index(:index)
end

# ロジスティック回帰
def run_logistic(train_set, plot)
  w = Numo::NArray[[0], [0.1], [0.1]]
  phi = train_set[:x, :y]
  phi[:bias] = Array.new(phi.size).fill(1)
  t = train_set[:type]
  t = t.to_matrix

  # 最大100回のIterationを実施
  100.times do
    # IRLS法によるパラメータの修正
    y = []
    phi.each_row do |line|
      a = Vector[*line.to_a].dot(w)
      y << (1.0 / (1.0 + Math.exp(-a)))
    end
    r = Matrix.diagonal(*(Numo::NArray[*y] * (1 - Numo::NArray[*y]).to_a))
    y = Numo::NArray[y].transpose
    tmp1 = Matrix[*Numo::NArray[*phi.to_matrix.transpose.to_a].dot(Numo::NArray[*r.to_a]).dot(Numo::NArray[*phi.to_matrix.to_a]).to_a].inverse
    tmp2 = Numo::NArray[*phi.to_matrix.transpose.to_a].dot(y - Numo::NArray[*t.transpose.to_a])
    w_new = w - Numo::NArray[*tmp1.to_a].dot(tmp2)

    # パラメータの変化が 0.1% 未満になったら終了
    if (w_new - w).transpose.dot(w_new - w).flatten[0] < (0.001 * (w.transpose.dot(w))).flatten[0]
      w = w_new
      break
    end
  end

  # 分類誤差の計算と確率付きデータの用意
  d0 = w[0]
  dx = w[1]
  dy = w[2]
  err = 0
  train_set[:probability] = Array.new(train_set.size).fill(0.0)

  train_set.each_row_with_index do |line, index|
    a = Vector[1, line.x, line.y].dot(w)
    p = 1.0 / (1.0 + Math.exp(-a))
    v = train_set.row[index]
    v[:probability] = p
    train_set.set_row_at([index], v)
    if (p - 0.5) * (line[:type] * 2 - 1) < 0
      err += 1
    end
  end

  err_rate = err * 100 / train_set.size

  # 境界線(P=0.5)を表示
  xmin = train_set.x.min - 5
  xmax = train_set.x.max + 5
  linex = Numo::NArray[*(xmin.to_i-5..xmax.to_i+4).to_a]
  liney = -linex * dx / dy - d0 / dy
  label = "ERR %.2f%%" % err_rate

  line_err = plot.add(:line, linex.cast_to(Numo::Int64).to_a, liney.cast_to(Numo::Int64).to_a)
  line_err.title(label)
  line_err.color('blue')

  # 確率付きデータを返却
  sorted_train_set = train_set.sort([:probability], ascending: false)
  sorted_train_set[:index] = sorted_train_set.size.times.to_a
  sorted_train_set.set_index(:index)
end

def run_simulation(variance, plot)
  train_set = prepare_dataset(variance)
  train_set1 = train_set.filter_rows {|row| row[:type] == 1 }
  train_set2 = train_set.filter_rows {|row| row[:type] == 0 }
  ymin = train_set.y.min - 5
  xmin = train_set.x.min - 5
  ymax = train_set.y.max + 10
  xmax = train_set.x.max + 10
  plot.configure do
    x_label("Variance: #{variance}")
    y_label('')
    xrange([xmin, xmax])
    yrange([ymin, ymax])
    legend(true)
    height(300)
    width(490)
  end

  scatter_true = plot.add_with_df(train_set1.to_nyaplotdf, :scatter, :x, :y)
  scatter_true.color('green')
  scatter_true.title('1')
  scatter_false = plot.add_with_df(train_set2.to_nyaplotdf, :scatter, :x, :y)
  scatter_false.color('orange')
  scatter_false.title('0')

  run_logistic(train_set, plot)
end

def draw_roc(result, plot)
  positives = result.filter_rows {|row| row[:type] == 1 }.size
  negatives = result.filter_rows {|row| row[:type] == 0 }.size
  tp = result.size.times.map { 0.0 }
  fp = result.size.times.map { 0.0 }
  result.each_row_with_index do |line, index|
    result.size.times do |c|
      if index < c
        if line[:type] == 1
          tp[c] += 1
        else
          fp[c] += 1
        end
      end
    end
  end

  tp_rate = Numo::NArray[*tp] / positives
  fp_rate = Numo::NArray[*fp] / negatives

  plot.configure do
    x_label('False positive rate')
    y_label('True positive rate')
    xrange([0, 1])
    yrange([0, 1])
    height(300)
    width(400)
  end

  plot.add(:line, fp_rate, tp_rate)
end

fig = Nyaplot::Frame.new

Variances.each do |variance|
  plot = Nyaplot::Plot.new
  result = run_simulation(variance, plot)
  fig.add(plot)

  plot = Nyaplot::Plot.new
  draw_roc(result, plot)
  fig.add(plot)
end

fig.show
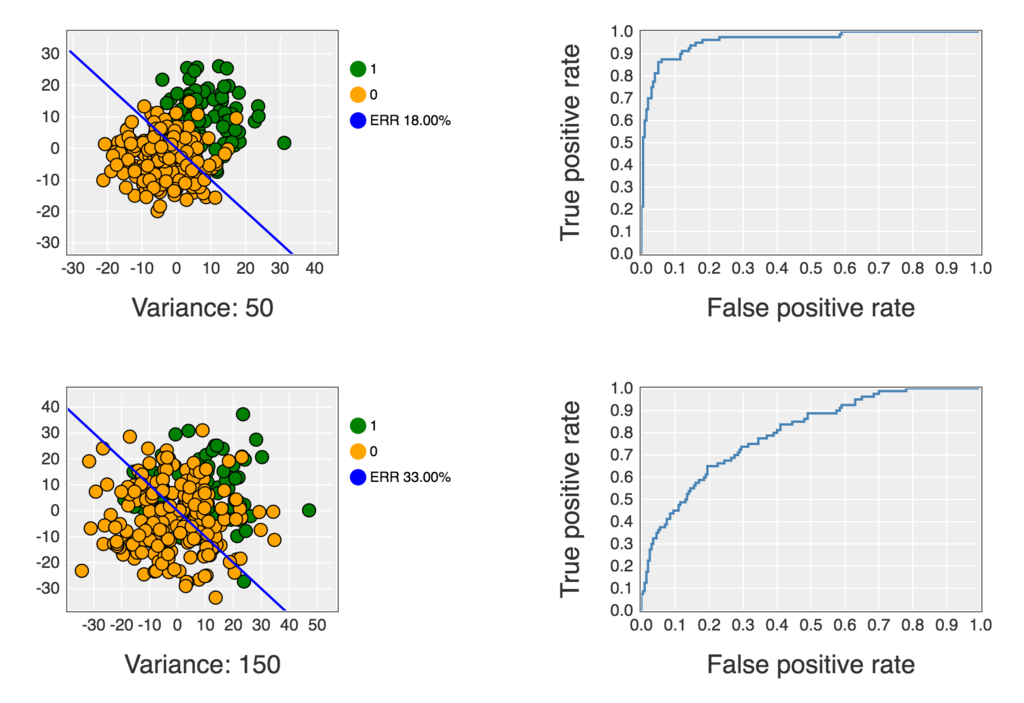
これを Jupyter Notebook 上で実行すると下記のようなグラフが表示されます。

コードは下記にも公開してあります。