ベイズ推定による回帰分析のコード

 今回は下記書籍のベイズ推定による回帰分析のコードを Ruby で実装してみたいと思います。今回で下記書籍のコードの置き換えは終了です。

www.amazon.co.jp

 サンプルコードはこちらで公開されています。

github.com

単位行列の生成

 Python版では numpy.identity メソッドで単位行列を生成しています。引数で指定した行数の正方行列になります。

>>> import numpy as np
>>> 
>>> np.identity(3)
array([[ 1.,  0.,  0.],
       [ 0.,  1.,  0.],
       [ 0.,  0.,  1.]])
>>> 

numpy.identity — NumPy v1.12 Manual

こちらも参考にさせていただきました。
Pythonの数値計算ライブラリ NumPy入門 « Rest Term

 Ruby版では Numo::DFloat.eye メソッドを使用しました。

irb(main):039:0* require 'numo/narray'
=> true                               
irb(main):040:0>                      
irb(main):041:0* Numo::DFloat.eye(3)  
=> Numo::DFloat#shape=[3,3]           
[[1, 0, 0],                           
 [0, 1, 0],                           
 [0, 0, 1]]                           

Class: Numo::NArray — Documentation by YARD 0.9.8

対角線要素の取得

 Python版では numpy.diagonal メソッドで行列の対角線要素を配列として取得しています。

>>> np.array([[1,2,3],[4,5,6],[7,8,9]]).diagonal()
array([1, 5, 9])
>>> 

numpy.diagonal — NumPy v1.12 Manual

 Ruby版では Numo::NArray#diagonal メソッドを使用しました。

irb(main):079:0* Numo::NArray[[1,2,3],[4,5,6],[7,8,9]].diagonal
=> Numo::Int32(view)#shape=[3]                                 
[1, 5, 9]                                                      

Class: Numo::NArray — Documentation by YARD 0.9.8

行列の積

 Python版では numpy.dot メソッドで二次元配列の積を求めています。

>>> DataFrame([1,2,3])                               
   0                                                 
0  1                                                 
1  2                                                 
2  3                                                 
>>>                                                  
>>> DataFrame([1,2,3]).T                             
   0  1  2                                           
0  1  2  3                                           
>>>                                                  
>>> np.dot(DataFrame([1,2,3]), DataFrame([1,2,3]).T) 
array([[1, 2, 3],                                    
       [2, 4, 6],                                    
       [3, 6, 9]])                                   
>>>                                                  

 Ruby版ではMatrixを*でかけることで積を求めました。

irb(main):084:0* Daru::DataFrame.new(x: [1,2,3])
=> #<Daru::DataFrame(3x1)>
       x
   0   1
   1   2
   2   3
irb(main):085:0> 
irb(main):086:0* Daru::DataFrame.new(x: [1,2,3]).transpose
=> #<Daru::DataFrame(1x3)>
       0   1   2
   x   1   2   3
irb(main):087:0> 
irb(main):088:0* Daru::DataFrame.new(x: [1,2,3]).to_matrix * Daru::DataFrame.new(x: [1,2,3]).transpose.to_matrix
=> Matrix[[1, 2, 3], [2, 4, 6], [3, 6, 9]]

負の値の平方根

 Python版の下記コードにおいて、 numpy.sqrt メソッドで平方根を求めていますが、対象が負の値になることがあります。

deviation = np.sqrt(1.0/beta + np.dot(np.dot(phi_x0.T, s), phi_x0))

 numpy.sqrt メソッドは負の値に対して実行してもRuntimeWarningだけでエラーにはならず、nanを返します。

>>> np.sqrt(-1)                                              
__main__:1: RuntimeWarning: invalid value encountered in sqrt
nan                                                          
>>>                                                          

 Ruby版では Math.sqrt メソッドは負の値に対して実行するとエラーになってしまいます。

irb(main):002:0* Math.sqrt(-1)
Math::DomainError: Numerical argument is out of domain - "sqrt"
        from (irb):2:in `sqrt'
        from (irb):2
        from /usr/local/rbenv/versions/2.3.1/bin/irb:11:in `<main>'
irb(main):003:0> 

 なので対象が負の値の場合は明示的に Float::NAN を返すようにしました。

deviation = (1.0 / BETA + phi_x0.transpose.dot(Numo::NArray[*s.to_a]).dot(phi_x0)).map {|v| v < 0 ? Float::NAN : Math.sqrt(v) }

constant Float::NAN (Ruby 2.0.0)

多次元正規分布乱数の取得

 Python版では多項式のサンプル生成に numpy.random.multivariate_normal メソッドを使用しています。

ws_samples = DataFrame(multivariate_normal(mean,sigma,4))

 multivariate_normal は平均の配列と共分散行列を引数に取り、多次元正規分布乱数を生成してくれます。

 以前パーセプトロンの二項分類のコードをRuby版で実装した時にも出てきたメソッドで、その時は共分散を考慮しなくてもなんとかなるケースだったのですが、今回はそうもいかず、Rubyでの代替ができなかったので、Rubyのコードの中からPythonのコードを実行して結果を利用するようにしました。この書籍のコード置き換え最後にして(自分的には)禁じ手を使ってしまいました。。

  command = "python -c 'import numpy; print numpy.random.multivariate_normal(#{mean.to_a.inspect}, #{sigma.to_a.inspect}, 4).tolist()'"
  output, std_error, status = Open3.capture3(command)
  ws_samples = Daru::DataFrame.rows(eval(output))

 Open3.capture3 メソッドでは標準出力を返すので、 print で multivariate_normal の結果を出力するようにしています。また、戻り値は文字列なので、Rubyで配列として扱われるように eval しています。

 そして配列から Daru::DataFrame を生成するには Daru::DataFrame.rows メソッドを使用しました。

Method: Daru::DataFrame.rows — Documentation for daru (0.1.5)

スクリプト全体

 ここまでの内容を踏まえて、コード全体としては下記のように実装しました。

# ベイズ推定による回帰分析

require 'daru'
require 'numo/narray'
require 'open3'
require 'nyaplot'

DATASET_NUMS = [4, 5, 10, 100]

BETA = 1.0 / (0.3) ** 2 # 真の分布の分散
ALPHA = 1.0 / 100 ** 2  # 事前分布の分散
ORDER = 9               # 多項式の字数

def normal_rand(mu = 0, sigma = 1.0)
  random = Random.new
  (Math.sqrt(-2 * Math.log(random.rand)) * Math.sin(2 * Math::PI * random.rand) * sigma) + mu
end

# データセット {x_n,y_n} (n=1...N) を用意
def create_dataset(num)
  dataset = Daru::DataFrame.new({'x': [], 'y': []})  

  num.times do |i|
    x = i.to_f / (num - 1).to_f
    y = Math.sin(2 * Math::PI * x) + normal_rand(0, 0.3)
    dataset.add_row(Daru::Vector.new([x, y], index: [:x, :y]))
  end
  
  return dataset
end

# 事後分布に基づく推定曲線、および、事後分布の平均と分散を計算
def resolve(dataset, m)
  t = dataset.y

  columns = {}
  (m+1).times do |i|
    columns["x**#{i}"] = dataset.x ** i
  end
  phis = Daru::DataFrame.new(columns)

  phiphi = nil
  phis.each_row_with_index do |line, index|
    phi = Daru::DataFrame.new(x: line)
    if index == 0
      phiphi = phi.to_matrix * phi.transpose.to_matrix
    else
      phiphi += phi.to_matrix * phi.transpose.to_matrix
    end
  end

  s_inv = Matrix[*(ALPHA * Numo::DFloat.eye(m + 1))] + BETA * phiphi
  s = s_inv.inv # 事後分布の共分散行列

  # 平均 m(x)
  mean_fun = lambda {|x0|
    phi_x0 = Numo::NArray[*((m + 1).times.map {|i| (x0 ** i).to_a })]
    tmp = 0
    phis.each_row_with_index do |line, index|
      if index == 0
        tmp = t[index] * Numo::NArray[*line.to_a]
        next
      end

      tmp += t[index] * Numo::NArray[*line.to_a]
    end
    BETA * phi_x0.transpose.dot(Numo::NArray[*s.to_a]).dot(tmp)
  }

  # 標準偏差 s(x)
  deviation_fun = lambda {|x0|
    phi_x0 = Numo::NArray[*((m + 1).times.map {|i| (x0 ** i).to_a })]
    deviation = (1.0 / BETA + phi_x0.transpose.dot(Numo::NArray[*s.to_a]).dot(phi_x0)).map {|v| v < 0 ? Float::NAN : Math.sqrt(v) }
    deviation.diagonal
  }

  tmp = nil
  phis.each_row_with_index do |line, index|
    if index == 0
      tmp = t[index] * Numo::NArray[*line.to_a]
      next
    end

    tmp += t[index] * Numo::NArray[*line.to_a]
  end
  mean = BETA * Numo::NArray[*s.to_a].dot(tmp).flatten

  return mean_fun, deviation_fun, mean, s
end

fig1 = Nyaplot::Frame.new
fig2 = Nyaplot::Frame.new

DATASET_NUMS.each do |num|
  train_set = create_dataset(num)
  mean_fun, deviation_fun, mean, sigma = resolve(train_set, ORDER)
  command = "python -c 'import numpy; print numpy.random.multivariate_normal(#{mean.to_a.inspect}, #{sigma.to_a.inspect}, 4).tolist()'"
  output, std_error, status = Open3.capture3(command)
  ws_samples = Daru::DataFrame.rows(eval(output))
  
  # トレーニングセットを表示
  plot1 = Nyaplot::Plot.new
  scatter1 = plot1.add(:scatter, train_set.x.to_a, train_set.y.to_a)
  scatter1.color('blue')
  scatter1.title('train_set')
  
  plot1.configure do
    x_label("N=#{num}")
    y_label('')
    xrange([-0.05, 1.05])
    yrange([-2, 2])
    legend(true)
    height(300)
    width(490)
  end
  
  plot2 = Nyaplot::Plot.new
  scatter2 = plot2.add(:scatter, train_set.x.to_a, train_set.y.to_a)
  scatter2.color('blue')
  scatter2.title('train_set')

  plot2.configure do
    x_label("N=#{num}")
    y_label('')
    xrange([-0.05, 1.05])
    yrange([-2, 2])
    legend(true)
    height(300)
    width(490)
  end
  
  linex = Numo::NArray[*(0..1).step(0.01).to_a]

  # 真の曲線を表示
  liney = (2 * Math::PI * linex).map {|v| Math.sin(v) }
  collect_line = plot1.add(:line, linex, liney)
  collect_line.color('green')
  collect_line.title('collect')

  # 平均と標準偏差の曲線を表示
  m = mean_fun.call(linex)
  d = deviation_fun.call(linex)
  mean_line = plot1.add(:line, linex, m)
  mean_line.color('red')
  mean_line.title('mean')
  lower_std_line = plot1.add(:line, linex, m - d)
  lower_std_line.color('black')
  lower_std_line.title('')
  upper_std_line = plot1.add(:line, linex, m + d)
  upper_std_line.color('black')
  upper_std_line.title('')

  # 多項式のサンプルを表示
  liney = m
  mean_line = plot2.add(:line, linex, liney)
  mean_line.color('red')
  mean_line.title('mean')
  
  f = lambda {|x, ws|
    y = 0
    ws.each_with_index do |w, i|
      y += w * (x ** i.to_i)
    end
    y
  }

  ws_samples.each_row do |ws|
    liney = f.call(linex, ws)
    sample_line = plot2.add(:line, linex, liney)
    sample_line.color('pink')
    sample_line.title('sample')
  end
  
  fig1.add(plot1)
  fig2.add(plot2)
end

fig1.show
fig2.show

 これを Jupyter Notebook 上で実行すると下記のようなグラフが表示されます。

f:id:akanuma-hiroaki:20170301001605p:plain

f:id:akanuma-hiroaki:20170301001624p:plain

 コードは下記にも公開してあります。

github.com

ベイズ推定による正規分布の推定のコード

 今回は下記書籍のベイズ推定による正規分布の推定のコードを Ruby で実装してみたいと思います。

ITエンジニアのための機械学習理論入門
https://www.amazon.co.jp/IT-ebook/dp/B016Q22IX2/

 サンプルコードはこちらで公開されています。

github.com

スクリプト全体

 今回は使っているメソッド等は特に新しい要素はなかったので、スクリプト全体だけ掲載します。

# ベイズ推定による正規分布の推定

require 'rubystats/normal_distribution'
require 'nyaplot'

class Array
  def mean
    self.inject(:+) / self.size.to_f
  end
end

def normal_rand(mu = 0, sigma = 1.0)
  random = Random.new
  (Math.sqrt(-2 * Math.log(random.rand)) * Math.sin(2 * Math::PI * random.rand) * sigma) + mu
end

DATA_COUNTS = [2, 4, 10, 100]

# 真の分布
MU_TRUE = 2.0
BETA_TRUE = 1.0

# 事前分布
MU_0 = -2.0
BETA_0 = 1.0

ds = 100.times.map do
  normal_rand(MU_TRUE, 1.0 / BETA_TRUE)
end

fig1 = Nyaplot::Frame.new
fig2 = Nyaplot::Frame.new

DATA_COUNTS.each_with_index do |n, c|
  train_set = ds[0..n-1]
  mu_ML = train_set.mean
  mu_N = (BETA_TRUE * mu_ML + BETA_0 * MU_0 / n) / (BETA_TRUE + BETA_0 / n)
  beta_N = BETA_0 + n * BETA_TRUE

# 平均μの推定結果を表示
  plot = Nyaplot::Plot.new
  linex = (-10..10).step(0.01).to_a

  # 平均μの確率分布
  sigma = 1.0 / beta_N
  mu_est = Rubystats::NormalDistribution.new(mu_N, Math.sqrt(sigma))
  label = "mu_N=%.2f var=%.2f" % [mu_N, sigma]
  liney = linex.map {|x| mu_est.pdf(x) }
  line = plot.add(:line, linex, liney)
  line.title(label)
  line.color('red')

  # トレーニングセットを表示
  scatter = plot.add(:scatter, train_set, [0.2] * n)
  scatter.title('train_set')
  scatter.color('blue')

  plot.configure do
    x_label("N=#{n}")
    y_label('')
    xrange([-5, 5])
    yrange([0, liney.max * 1.1])
    legend(true)
    height(300)
    width(490)
  end

  fig1.add(plot)

# 次に得られるデータの推定分布を表示
  plot = Nyaplot::Plot.new
  
  # 真の分布を表示
  orig = Rubystats::NormalDistribution.new(MU_TRUE, Math.sqrt(1.0 / BETA_TRUE))
  liney = linex.map {|x| orig.pdf(x)}
  y_max = liney.max * 1.1
  line = plot.add(:line, linex, liney)
  line.title('original')
  line.color('green')
  
  # 推定分布を表示
  sigma = 1.0 / BETA_TRUE + 1.0 / beta_N
  mu_est = Rubystats::NormalDistribution.new(mu_N, Math.sqrt(sigma))
  label = "mu_N=%.2f var=%.2f" % [mu_N, sigma]
  liney = linex.map {|x| mu_est.pdf(x) }
  line = plot.add(:line, linex, liney)
  line.title(label)
  line.color('red')
  
  # トレーニングセットを表示
  scatter = plot.add(:scatter, train_set, train_set.map {|x| orig.pdf(x) })
  scatter.title('train_set')
  scatter.color('blue')

  plot.configure do
    x_label("N=#{n}")
    y_label('')
    xrange([-5, 5])
    yrange([0, y_max])
    legend(true)
    height(300)
    width(490)
  end

  fig2.add(plot)
end

fig1.show
fig2.show

 これを Jupyter Notebook 上で実行すると下記のようなグラフが表示されます。

f:id:akanuma-hiroaki:20170217073027p:plain

f:id:akanuma-hiroaki:20170217073042p:plain

 コードは下記にも公開してあります。

github.com

混合ベルヌーイ分布による手書き文字分類のコード

 今回は下記書籍の混合ベルヌーイ分布による手書き文字分類のコードを Ruby で実装してみたいと思います。

ITエンジニアのための機械学習理論入門
https://www.amazon.co.jp/IT-ebook/dp/B016Q22IX2/

 サンプルコードはこちらで公開されています。

github.com

一様乱数の複数生成

 Python版では numpy.random.rand メソッドを使って、一様乱数を複数生成しています。引数で生成数を指定できます。戻り値の型は numpy.ndarray になります。

numpy.random.rand — NumPy v1.12 Manual

 下記サイトも参考にさせていただきました。

qiita.com

>>> from numpy.random import randint, rand

>>> type(rand(28*28*K))
<type 'numpy.ndarray'> 

>>> rand(28*28*K)                                               
array([ 0.5395075 ,  0.98248117,  0.02652428, ...,  0.60618989, 
        0.55422211,  0.97170692])                    

>>> rand(28*28*K)*0.5+0.25                                     
array([ 0.27982902,  0.52512579,  0.6166757 , ...,  0.28828048,
        0.43710937,  0.70152255])                              

 Ruby版では複数の一様乱数を生成するようなメソッドは見つからなかったので、times と map で Random.rand の結果を Numo::NArray のオブジェクトとして返すようにしました。

instance method Random#rand (Ruby 2.4.0)

irb(main):002:0* require 'numo/narray'
=> true
irb(main):003:0> 
irb(main):004:0* K = 3
=> 3
irb(main):005:0> 
irb(main):006:0* random = Random.new
=> #<Random:0x007f5d8e5ba958>
irb(main):007:0> 
irb(main):008:0* (Numo::NArray[*(28*28*K).times.map { rand }] * 0.5 + 0.25).inspect
=> "Numo::DFloat#shape=[2352]\n[0.57563, 0.42476, 0.271377, 0.37791, 0.639573, 0.469103, 0.381991, ...]"
irb(main):009:0> 

配列の次元の操作

 Python版では numpy.reshape を使って、一次元配列を二次元配列に変換しています。

numpy.reshape — NumPy v1.12 Manual

 下記サイトも参考にさせていただきました。

配列の次元数や大きさの操作 — 機械学習の Python との出会い

>>> rand(28*28*K)*0.5+0.25                                     
array([ 0.27982902,  0.52512579,  0.6166757 , ...,  0.28828048,
        0.43710937,  0.70152255])                              

>>> (rand(28*28*K)*0.5+0.25).reshape(K, 28*28)                  
array([[ 0.45648701,  0.52251086,  0.64335816, ...,  0.58305645,
         0.6682408 ,  0.43845499],                              
       [ 0.56658712,  0.35430961,  0.43453176, ...,  0.47584553,
         0.28571063,  0.47738208],                              
       [ 0.45287756,  0.36832049,  0.66361054, ...,  0.57060036,
         0.32932144,  0.43710831]])                                        

 Ruby版では Numo::NArray に reshape メソッドがあるのでこちらを使用しました。

Class: Numo::NArray — Documentation by YARD 0.8.7.6

MF / Rubyの行列計算ライブラリ Numo::NArray 覚え書き

irb(main):008:0* (Numo::NArray[*(28*28*K).times.map { rand }] * 0.5 + 0.25).inspect
=> "Numo::DFloat#shape=[2352]\n[0.57563, 0.42476, 0.271377, 0.37791, 0.639573, 0.469103, 0.381991, ...]"
irb(main):009:0> 

irb(main):012:0* puts (Numo::NArray[*(28*28*K).times.map { rand }] * 0.5 + 0.25).reshape(K, 28 * 28).inspect         
Numo::DFloat#shape=[3,784]
[[0.34944, 0.607955, 0.691216, 0.556252, 0.291292, 0.466035, 0.680318, ...], 
 [0.707424, 0.483005, 0.541919, 0.708824, 0.287847, 0.266209, 0.354161, ...], 
 [0.627625, 0.688389, 0.510972, 0.673134, 0.579064, 0.355312, 0.513933, ...]]
=> nil

二次元配列の要素指定と合計値の計算

 Python版では ndarray の一次元目のインデックスを指定すると該当する配列が取得できます。そして sum() メソッドで合計値が取得できます。

>>> mu[0]                                                              
array([ 0.50779561,  0.40787245,  0.48671511,  0.65496467,  0.3637279 ,
        0.39219046,  0.53240974,  0.33735545,  0.63518755,  0.26163205,
        0.28325156,  0.4229063 ,  0.3944319 ,  0.66258652,  0.33099521,
        0.6460817 ,  0.58168761,  0.63767735,  0.59634922,  0.61818323,
〜〜〜 以下略 〜〜〜

>>> mu[0].sum()   
399.46258992135597

 Ruby版では Numo::NArray で同様に配列を取得するには一次元目だけでなく二次元目のインデックス範囲も指定する必要があります。そして合計値は sum メソッドで取得できます。

http://ruby-numo.github.io/narray/narray/Numo/DFloat.html#%5B%5D-instance_method

http://ruby-numo.github.io/narray/narray/Numo/DFloat.html#sum-instance_method

irb(main):030:0* mu[0,0..-1]
=> Numo::DFloat(view)#shape=[784]
[0.329509, 0.738836, 0.516475, 0.461981, 0.519925, 0.577925, 0.477174, ...]
irb(main):031:0> 
irb(main):032:0* mu[0,0..-1].sum
=> 392.4870691553733

画像データの表示

 Python版では配列データとして保持している画像データを画像として表示するために、 matplotlab の imshow を使用しています。一つの手書き文字データのピクセルデータの一次元配列を 28 x 28 の二次元配列に変換し、カラーマップにグレースケールを指定しています。また、元データはピクセルが黒だったら 1、白だったら 0 というデータなので、グレースケールとしては逆の指定になるため _r をつけた plt.cm.gray_r を指定しています。

subplot.imshow(mu[k].reshape(28,28), cmap=plt.cm.gray_r)

Image tutorial — Matplotlib 2.0.0 documentation

NumPyで画像処理 | mwSoft

pyplot — Matplotlib 2.0.0 documentation

 Ruby版では Nyaplot で簡単に画像を扱うことはできなそうだったので、 RMagick で画像データを生成し、 IRuby.display で画像を Jupyter Notebook 上に表示しました。imshow では渡したデータの上限値と下限値を自動的にスケールの上限と下限として扱ってくれるのですが、 import_pixel では自動的に変換はしてくれないので、最大値が 1.0 になるように map の中で変換して、 Float データであることを示すために、StorateType のパラメータには FloatPixel を指定しています。また、白黒を反転するために map の中では 1 から値を引いたものを使用するようにしています。

rate = 1.0 / mu[k, 0..-1].max
image = Magick::Image.new(28, 28)
image.import_pixels(0, 0, 28, 28, 'I', mu[k, 0..-1].map {|v| 1 - v * rate }.to_a, Magick::FloatPixel)
IRuby.display image

RMagick 2.12.0: class Image (instance methods e-o)

3階建ての2階角部屋 2nd : ruby/tk + narray + rmagick でpixel操作(RGB)

ゼロ埋め配列データの生成

 Python版では numpy.zeros でパラメータで指定した要素数のゼロ埋めの配列を生成しています。

numpy.zeros — NumPy v1.12 Manual

mu = np.zeros((K, 28*28))

 Ruby 版では Numo::DFloat.zeros を使用しました。

Class: Numo::NArray — Documentation by YARD 0.8.7.6

mu = Numo::DFloat.zeros(K, 28 * 28)

配列データの最大値の要素のインデックス取得

 Python版では配列データの最大値を持つ要素のインデックスを取得するために、 numpy.argmax を使用しています。

for index, line in resp.iterrows():
    cls.append(np.argmax(line[0:]))

numpy.argmax — NumPy v1.12 Manual

NumPy配列の最大値/最小値に関する関数 | hydroculのメモ

 Ruby版では Numo::DFloat#max_index というメソッドがあるのでこちらを使用しました。

Class: Numo::DFloat — Documentation by YARD 0.8.7.6

cls = resp.map.with_index do |line, index|
  Numo::NArray[*line].max_index
end

スクリプト全体

 ここまでの内容を踏まえて、コード全体としては下記のように実装しました。

# 混合ベルヌーイ分布による手書き文字分類

require 'csv'
require 'numo/narray'
require 'rmagick'

K = 3  # 分類する文字数
N = 10 # 反復回数

# 分類結果の表示
def show_figure(df, mu, cls)
  K.times do |c|
    rate = 1.0 / mu[c, 0..-1].max
    image = Magick::Image.new(28, 28)
    image.import_pixels(0, 0, 28, 28, 'I', mu[c, 0..-1].map {|v| 1 - v * rate }.to_a, Magick::FloatPixel)
    puts "Master #{c}"
    IRuby.display image

    cnt = 0
    cls.each_with_index do |v, i|
      if v == c
        rate = 1.0 / df[i].max
        image = Magick::Image.new(28, 28)
        image.import_pixels(0, 0, 28, 28, 'I', df[i].map {|d| 1 - d * rate }, Magick::FloatPixel)
        IRuby.display image
        cnt += 1
      end
      
      break if cnt == 6
    end
  end
end

# ベルヌーイ分布
def bern(x, mu)
  r = 1.0
  x.zip(mu).each do |x_i, mu_i|
    if x_i == 1
      r *= mu_i
      next
    end

    r *= (1.0 - mu_i)
  end

  r
end

# トレーニングセットの読み込み
df = CSV.read('sample-images.txt').map {|line| line.map(&:to_i) }
data_num = df.size

# 初期パラメータの設定
mix = [1.0 / K] * K
random = Random.new
mu = (Numo::NArray[*(28 * 28 * K).times.map { rand }] * 0.5 + 0.25).reshape(K, 28 * 28)

K.times do |k|
  mu[k, 0..-1] /= mu[k, 0..-1].sum
end

puts "initial"
K.times do |k|
  rate = 1.0 / mu[k, 0..-1].max
  image = Magick::Image.new(28, 28)
  image.import_pixels(0, 0, 28, 28, 'I', mu[k, 0..-1].map {|v| 1 - v * rate }.to_a, Magick::FloatPixel)
  IRuby.display image
end

resp = nil
N.times do |iter_num|
  puts "iter_num #{iter_num}"

  # E Phase
  resp = []
  df.each_with_index do |line, index|
    tmp = []
    K.times do |k|
      a = mix[k] * bern(line, mu[k, 0..-1])
      if a == 0.0
        tmp << 0.0
      else
        s = 0.0
        K.times do |kk|
          s += mix[kk] * bern(line, mu[kk, 0..-1])
        end
        tmp << a / s
      end
    end
    resp << tmp
  end

  # M Phase
  mu = Numo::DFloat.zeros(K, 28 * 28)
  K.times do |k|
    nk = resp.transpose[k].inject(:+)
    mix[k] = nk / data_num
    df.each_with_index do |line, index|
      mu[k, 0..-1] = mu[k, 0..-1] + Numo::NArray[*line].cast_to(Numo::DFloat) * resp[index][k]
    end
    mu[k, 0..-1] /= nk

    rate = 1.0 / mu[k, 0..-1].max
    image = Magick::Image.new(28, 28)
    image.import_pixels(0, 0, 28, 28, 'I', mu[k, 0..-1].map {|v| 1 - v * rate }.to_a, Magick::FloatPixel)
    IRuby.display image
  end
end

# トレーニングセットの文字を分類
cls = resp.map.with_index do |line, index|
  Numo::NArray[*line].max_index
end

# 分類結果の表示
show_figure(df, mu, cls)

 これを Jupyter Notebook 上で実行すると、ランダムに作成された3つの画像生成器が表示され、それぞれがEMアルゴリズムで更新された画像が10回目まで順次表示されます。その後で、EMアルゴリズムで生成された画像生成器によってテストデータを分類した結果を6個ずつ表示します。Python 版で matplotlab でやっているように見やすく表形式で表示したかったのですが、 gnuplot 等調べてみたものの時間がかかりそうだったので、今回は分類自体はちゃんとできてそうだという確認までにしました。表示された画像を見やすく並べると下記のようになります。まずは画像生成器を更新していくところから。

f:id:akanuma-hiroaki:20170213224743j:plainf:id:akanuma-hiroaki:20170213224744j:plainf:id:akanuma-hiroaki:20170213224745j:plainf:id:akanuma-hiroaki:20170213224746j:plainf:id:akanuma-hiroaki:20170213224747j:plainf:id:akanuma-hiroaki:20170213224748j:plainf:id:akanuma-hiroaki:20170213224749j:plainf:id:akanuma-hiroaki:20170213224750j:plainf:id:akanuma-hiroaki:20170213224751j:plainf:id:akanuma-hiroaki:20170213224752j:plainf:id:akanuma-hiroaki:20170213224753j:plain
f:id:akanuma-hiroaki:20170213224822j:plainf:id:akanuma-hiroaki:20170213224823j:plainf:id:akanuma-hiroaki:20170213224824j:plainf:id:akanuma-hiroaki:20170213224825j:plainf:id:akanuma-hiroaki:20170213224826j:plainf:id:akanuma-hiroaki:20170213224827j:plainf:id:akanuma-hiroaki:20170213224828j:plainf:id:akanuma-hiroaki:20170213224829j:plainf:id:akanuma-hiroaki:20170213224830j:plainf:id:akanuma-hiroaki:20170213224831j:plainf:id:akanuma-hiroaki:20170213224832j:plain
f:id:akanuma-hiroaki:20170213224900j:plainf:id:akanuma-hiroaki:20170213224901j:plainf:id:akanuma-hiroaki:20170213224902j:plainf:id:akanuma-hiroaki:20170213224903j:plainf:id:akanuma-hiroaki:20170213224904j:plainf:id:akanuma-hiroaki:20170213224905j:plainf:id:akanuma-hiroaki:20170213224906j:plainf:id:akanuma-hiroaki:20170213224907j:plainf:id:akanuma-hiroaki:20170213224908j:plainf:id:akanuma-hiroaki:20170213224909j:plainf:id:akanuma-hiroaki:20170213224910j:plain

 次に画像生成器によって分類された結果です。一番左の画像は画像生成器のデータで、分類されたデータがその右に並んでいます。

f:id:akanuma-hiroaki:20170213225423j:plainf:id:akanuma-hiroaki:20170213225424j:plainf:id:akanuma-hiroaki:20170213225425j:plainf:id:akanuma-hiroaki:20170213225426j:plainf:id:akanuma-hiroaki:20170213225427j:plainf:id:akanuma-hiroaki:20170213225428j:plainf:id:akanuma-hiroaki:20170213225429j:plain
f:id:akanuma-hiroaki:20170213225508j:plainf:id:akanuma-hiroaki:20170213225509j:plainf:id:akanuma-hiroaki:20170213225510j:plainf:id:akanuma-hiroaki:20170213225511j:plainf:id:akanuma-hiroaki:20170213225512j:plainf:id:akanuma-hiroaki:20170213225513j:plainf:id:akanuma-hiroaki:20170213225514j:plain
f:id:akanuma-hiroaki:20170213225532j:plainf:id:akanuma-hiroaki:20170213225533j:plainf:id:akanuma-hiroaki:20170213225534j:plainf:id:akanuma-hiroaki:20170213225535j:plainf:id:akanuma-hiroaki:20170213225536j:plainf:id:akanuma-hiroaki:20170213225537j:plainf:id:akanuma-hiroaki:20170213225741j:plain

 実行する度に結果は異なり、誤判定されるデータもありますが、元のPython版と比較して大体同じ程度の精度にはなっているようなので、ひとまずは問題なさそうかと思います。

 コードは下記に公開しました。

github.com

 ちなみに上記スクリプトを実行する前にトレーニングセットを絞り込むための準備用のスクリプトがあるのですが、こちらも一応Rubyで実装して下記に置いてあります。

ml4se_study/07-prep_data.rb at master · h-akanuma/ml4se_study · GitHub

k平均法による画像の減色処理のコード

 今回は下記書籍のk平均法による画像の減色処理のコードを Ruby で実装してみたいと思います。

ITエンジニアのための機械学習理論入門
https://www.amazon.co.jp/IT-ebook/dp/B016Q22IX2/

 サンプルコードはこちらで公開されています。

github.com

画像ファイルの読み込み

 Python版ではPILライブラリのImageクラスを使って画像ファイルを読み込み、RGBデータとして取得して配列にしています。

Python Imaging Library (PIL)

The Python Imaging Library Handbook

from PIL import Image

im = Image.open("photo.jpg")
pixels = list(im.convert('RGB').getdata())

 Ruby版では ImageMagick をインストールし、RMagick を使って画像を扱いました。

github.com

RMagick 2.12.0 User's Guide and Reference

https://rmagick.github.io/image2.html#export_pixels

 下記サイトを参考にさせていただき、 export_pixels メソッドで取得した 16bit のRGBデータを 8bit に変換しました。

d.hatena.ne.jp

irb(main):001:0> require 'rmagick'
=> true
irb(main):002:0> img = Magick::ImageList.new('./photo.jpg')
=> [./photo.jpg JPEG 520x346 520x346+0+0 DirectClass 8-bit 46kb]
scene=0
irb(main):003:0> img.export_pixels.map {|p| p / 257 }.each_slice(3).to_a

乱数の取得

 Python版ではランダムな整数を取得するために numpy.random.randint を使っています。

from numpy.random import randint

randint(256)

numpy.random.randint — NumPy v1.12 Manual

 このメソッドは引数に渡した整数未満のランダムな整数を返すと言うことで、引数もその範囲に含む random.randint とは動きが異なるようです。

qiita.com

 Ruby版では Random#rand メソッドが同様の挙動になります。

random = Random.new

random.rand(256)

class Random (Ruby 2.4.0)

Rubyでランダムな数値を得る方法 -- ぺけみさお

ゼロ徐算によるエラーの回避

 Python版ではk平均法によって新しい代表点を求める際に、下記のような計算を行なっています。

for i in range(k):
    center_new[i] = center_new[i] / num_points[i]

 このとき、特にクラスタ数が多いケースだと、あるクラスタに属する点がないときに num_points[i] が 0 になり、ゼロ徐算が発生します。 center_new[i] は ndarray のオブジェクトですが、通常の数値計算のゼロ徐算だとエラーになるのに対し、ndarrayに対するゼロ徐算はWarningで、エラーにはならないようです。

>>> np.array([100, 100, 100]) / 0                               
__main__:1: RuntimeWarning: divide by zero encountered in divide
array([0, 0, 0])                                                

 Ruby では Numo::NArray に対するゼロ徐算はエラーになります。

irb(main):085:0* Numo::NArray[100,100,100] / 0
ZeroDivisionError: error in NArray operation
        from (irb):85:in `/'
        from (irb):85
        from /usr/local/rbenv/versions/2.3.1/bin/irb:11:in `<main>'

 このエラーを回避するために、 num_points[i] が 0 の場合は、 Numo::NArray[0, 0, 0] を返すようにしました。

k.times do |i|
  if num_points[i] == 0
    center_new[i] = Numo::NArray[0, 0, 0]
    next
  end

  center_new[i] = center_new[i] / num_points[i]
end

画像ファイルの変更、保存

 Python版では読み込み時と同様にPILを使用し、元の画像にputdataで計算結果を反映し、ビットマップ形式の別ファイルとして保存しています。

im.putdata(result) # Update image
im.save("output%02d.bmp" % k, "BMP")

 Ruby版では Magick::Image#import_pixels で計算結果を反映して、 Magick::Image#write で別ファイルとして保存しました。読み込みの時に export_pixels で取得した配列データを 8bit に変換してRGB区切りの配列データにしたので、それとは逆に、一次元配列に戻して16bitに変換したものを渡しています。

img.import_pixels(0, 0, img.columns, img.rows, "RGB", result.flatten.map {|p| p * 257 })
img.write("bmp:output%02d.bmp" % k)

https://rmagick.github.io/image2.html#import_pixels

https://rmagick.github.io/image3.html#write

スクリプト全体

 ここまでの内容を踏まえて、コード全体としては下記のように実装しました。

# k平均法による画像の減色処理

require 'rmagick'
require 'numo/narray'

Colors = [2, 3, 5, 16]  # 減色後の色数

# k平均法による減色処理
def run_kmeans(pixels, k)
  cls = Array.new(pixels.size).fill(0)

  # 代表色の初期値をランダムに設定
  random = Random.new
  center = k.times.map { Numo::NArray[random.rand(256), random.rand(256), random.rand(256)] }
  puts "Initial centers: #{center.map(&:to_a)}"
  puts "========================"
  distortion = 0.0

  # 最大50回のIterationを実施
  50.times do |iter_num|
    center_new = Array.new(k).fill(Numo::NArray[0, 0, 0])
    num_points = Array.new(k).fill(0)
    distortion_new = 0.0

    # E Phase: 各データが属するグループ(代表色)を計算
    pixels.each_with_index do |point, pix|
      min_dist = 256 * 256 * 3
      point = Numo::NArray[*point]
      k.times do |i|
        d = (point - center[i]).cast_to(Numo::Int64).to_a.inject(0) {|sum, x| sum + (x ** 2) }
        if d < min_dist
          min_dist = d
          cls[pix] = i
        end

        center_new[cls[pix]] += point
        num_points[cls[pix]] += 1
        distortion_new += min_dist
      end
    end

    # M Phase: 新しい代表色を計算
    k.times do |i|
      if num_points[i] == 0
        center_new[i] = Numo::NArray[0, 0, 0]
        next
      end

      center_new[i] = center_new[i] / num_points[i]
    end
    center = center_new
    puts center.map(&:to_a).inspect
    puts "Distortion: J=#{distortion_new}"

    # Distortion(J)の変化が0.1%未満になったら終了
    if iter_num > 0 && distortion - distortion_new < distortion * 0.001
      break
    end
    distortion = distortion_new
  end

  # 画像データの各ピクセルを代表色で置き換え
  pixels.each_with_index do |point, pix|
    pixels[pix] = center[cls[pix]].to_a
  end

  pixels
end

Colors.each do |k|
  puts ""
  puts "========================"
  puts "Number of clusters: K=#{k}"

  # 画像ファイルの読み込み
  img = Magick::ImageList.new('./photo.jpg')
  pixels = img.export_pixels.map {|p| p / 257 }.each_slice(3).to_a

  # k平均法による減色処理
  result = run_kmeans(pixels, k)
  img.import_pixels(0, 0, img.columns, img.rows, "RGB", result.flatten.map {|p| p * 257 })
  img.write("bmp:output%02d.bmp" % k)
end

 これを実行するとターミナル上では下記のように、初期のランダムな代表点と、計算ごとに変化していく代表点と二乗歪み(J)の値が出力されます。

$ ruby 06-k_means.rb 

========================
Number of clusters: K=2
Initial centers: [[73, 209, 26], [101, 193, 89]]
========================
[[147, 136, 114], [177, 155, 141]]
Distortion: J=11686169170.0
[[140, 126, 102], [231, 210, 215]]
Distortion: J=5777512344.0
[[143, 126, 103], [237, 225, 228]]
Distortion: J=4710119998.0
[[143, 126, 104], [238, 228, 231]]
Distortion: J=4670715192.0
[[143, 126, 104], [238, 228, 231]]
Distortion: J=4668708398.0

========================
Number of clusters: K=3
Initial centers: [[214, 192, 131], [132, 203, 96], [118, 69, 71]]
========================
[[193, 169, 164], [99, 112, 65], [104, 83, 52]]
Distortion: J=8555090758.0
[[192, 173, 165], [102, 106, 61], [105, 55, 41]]
Distortion: J=6458497492.0
[[192, 173, 165], [101, 104, 60], [110, 46, 40]]
Distortion: J=6391712615.0
[[192, 173, 165], [100, 103, 59], [120, 41, 42]]
Distortion: J=6384285256.0
[[192, 173, 165], [96, 101, 56], [153, 33, 52]]
Distortion: J=6369689981.0
[[191, 173, 165], [94, 100, 55], [182, 35, 64]]
Distortion: J=6295123108.0
[[191, 174, 165], [93, 99, 54], [185, 38, 68]]
Distortion: J=6267370834.0
[[191, 174, 165], [93, 99, 54], [186, 40, 70]]
Distortion: J=6265803130.0

========================
Number of clusters: K=5
Initial centers: [[194, 128, 53], [20, 175, 19], [143, 69, 162], [10, 6, 13], [232, 145, 213]]
========================
[[164, 135, 117], [67, 100, 43], [219, 196, 202], [49, 63, 25], [235, 218, 223]]
Distortion: J=17277755636.0
[[174, 141, 131], [84, 99, 48], [235, 220, 224], [71, 50, 25], [245, 243, 244]]
Distortion: J=7740485201.0
[[179, 148, 140], [91, 101, 52], [237, 227, 230], [89, 45, 29], [250, 249, 249]]
Distortion: J=7006558605.0
[[182, 151, 144], [94, 102, 54], [238, 230, 233], [103, 42, 34], [251, 251, 251]]
Distortion: J=6813616639.0
[[183, 153, 146], [94, 102, 54], [239, 232, 234], [118, 38, 38], [252, 252, 252]]
Distortion: J=6752640626.0
[[183, 154, 147], [90, 99, 52], [239, 232, 235], [164, 29, 51], [252, 252, 252]]
Distortion: J=6699438034.0
[[182, 155, 147], [89, 98, 52], [239, 233, 235], [181, 32, 61], [252, 252, 252]]
Distortion: J=6536049096.0
[[182, 156, 147], [89, 98, 51], [239, 233, 235], [183, 35, 64], [252, 252, 252]]
Distortion: J=6513101512.0
[[182, 156, 147], [89, 98, 51], [239, 233, 235], [184, 36, 65], [252, 252, 252]]
Distortion: J=6510842397.0

========================
Number of clusters: K=16
Initial centers: [[240, 182, 207], [150, 87, 15], [121, 236, 188], [140, 204, 22], [66, 131, 79], [157, 120, 116], [17, 196, 63], [164, 6, 24], [34, 40, 245], [45, 113, 4], [229, 65, 229], [117, 158, 111], [114, 36, 146], [51, 62, 230], [
48, 35, 252], [14, 78, 55]]
========================
[[225, 210, 211], [118, 82, 56], [151, 171, 141], [124, 151, 86], [82, 111, 55], [176, 118, 115], [0, 0, 0], [176, 22, 51], [0, 0, 0], [49, 76, 26], [234, 96, 155], [125, 150, 99], [131, 57, 81], [0, 0, 0], [0, 0, 0], [38, 63, 27]]
Distortion: J=17994009460.0
[[226, 215, 214], [117, 78, 55], [169, 157, 139], [116, 141, 83], [78, 107, 48], [201, 99, 122], [24, 49, 15], [180, 25, 54], [0, 0, 0], [46, 72, 26], [224, 103, 146], [121, 147, 105], [153, 62, 72], [0, 0, 0], [0, 0, 0], [32, 57, 20]]
Distortion: J=12774225380.0
[[226, 216, 215], [115, 77, 53], [176, 153, 141], [112, 137, 80], [75, 105, 46], [210, 84, 119], [31, 57, 19], [179, 23, 52], [9, 21, 8], [49, 74, 28], [226, 116, 157], [125, 150, 107], [163, 67, 73], [0, 0, 0], [0, 0, 0], [33, 59, 20]]
Distortion: J=12102951219.0
[[226, 217, 216], [114, 77, 53], [181, 150, 142], [110, 136, 78], [74, 103, 44], [211, 74, 114], [34, 59, 20], [177, 22, 49], [14, 35, 10], [51, 76, 29], [226, 129, 164], [129, 152, 106], [168, 70, 77], [0, 0, 0], [0, 0, 0], [36, 62, 21]]
Distortion: J=11926470826.0
[[226, 217, 216], [113, 78, 53], [184, 148, 143], [109, 135, 77], [73, 102, 43], [210, 68, 109], [35, 61, 21], [174, 21, 47], [18, 41, 12], [52, 78, 30], [227, 135, 168], [131, 152, 106], [170, 73, 79], [0, 0, 0], [0, 0, 0], [39, 65, 21]]
Distortion: J=11849083461.0
[[226, 217, 216], [112, 79, 53], [186, 146, 144], [108, 135, 77], [72, 101, 43], [209, 64, 105], [37, 62, 21], [172, 20, 45], [20, 45, 13], [53, 79, 31], [227, 137, 170], [132, 152, 107], [169, 76, 80], [9, 18, 5], [0, 0, 0], [42, 67, 21]
]
Distortion: J=11816838760.0
[[226, 217, 216], [111, 80, 53], [188, 145, 144], [108, 135, 77], [72, 101, 42], [208, 60, 102], [38, 63, 22], [171, 19, 44], [22, 47, 14], [54, 79, 32], [227, 138, 171], [133, 152, 107], [168, 80, 81], [10, 27, 9], [0, 0, 0], [44, 69, 21
]]
Distortion: J=11800409417.0
[[226, 217, 216], [110, 81, 53], [189, 143, 144], [108, 135, 77], [71, 101, 42], [207, 58, 99], [39, 64, 22], [170, 19, 43], [23, 48, 14], [54, 79, 32], [228, 138, 171], [134, 153, 108], [167, 84, 82], [12, 33, 9], [0, 0, 0], [46, 71, 20]
]
Distortion: J=11789721844.0

 そして下記の元画像に対して、代表色を2色、3色、5色、16色に減色した画像が生成されます。元画像はPython版のサンプルコードと一緒に公開されているものをそのまま使わせていただきましたが、生成後の画像もPython版と同じようなものが生成できたので、問題なさそうです。

オリジナル画像
f:id:akanuma-hiroaki:20170202084457j:plain

2色
f:id:akanuma-hiroaki:20170202084508j:plain

3色
f:id:akanuma-hiroaki:20170202084509j:plain

5色
f:id:akanuma-hiroaki:20170202084510j:plain

16色
f:id:akanuma-hiroaki:20170202084511j:plain

 コードは下記にも公開しました。

github.com

ロジスティック回帰のROC曲線のコード

 今回は下記書籍のロジスティック回帰のROC曲線のコードを Ruby で実装してみたいと思います。

ITエンジニアのための機械学習理論入門

www.amazon.co.jp

 サンプルコードはこちらで公開されています。

github.com

データセットの更新

 Python版では計算結果の確率をデータセットに反映する際に、下記のように pandas.DataFrame.ix メソッドを使って対象を特定し、値を代入しています。

p = 1.0/(1.0+np.exp(-a))
training_set.ix[index, 'probability'] = p

pandas.DataFrame.ix — pandas 0.19.2 documentation

 Ruby版ではデータの取り出しと代入を一度では行えなさそうだったので、 Daru::DataFrame#row で Vector オブジェクトを取得し、値を更新した上で Daru::DataFrame#set_row_at で更新するやり方にしてみました。

p = 1.0 / (1.0 + Math.exp(-a))
v = train_set.row[index]
v[:probability] = p
train_set.set_row_at([index], v)

Method: Daru::DataFrame#row — Documentation for daru (0.1.4.1)

Method: Daru::DataFrame#set_row_at — Documentation for daru (0.1.4.1)

データセットのソート

 Python版では pandas.DataFrame.sort_values メソッドを使ってデータセットを確率の高い順にソートしています。

result = training_set.sort_values(by=['probability'], ascending=[False])

pandas.DataFrame.sort_values — pandas 0.19.2 documentation

 Ruby版では Daru::DataFrame#sort メソッドを使ってソートしました。

sorted_train_set = train_set.sort([:probability], ascending: false)

Method: Daru::DataFrame#sort — Documentation for daru (0.1.4.1)

Class: Daru::DataFrame — Documentation for daru (0.1.4.1)

Indexの振り直し

 Python版ではソート後のデータセットのインデックスを pandas.DataFrame.reset_index メソッドで振り直しています。

return result.reset_index()

pandas.DataFrame.reset_index — pandas 0.19.2 documentation

 Ruby版では単純にインデックスを振り直すやり方がみつからなかったので、Indexに入れる値を別の列のデータとして追加した後、 Daru::DataFrame#reindex でその列をインデックスとして使うように変更しました。

Method: Daru::DataFrame#set_index — Documentation for daru (0.1.4.1)

sorted_train_set[:index] = sorted_train_set.size.times.to_a
sorted_train_set.set_index(:index)

スクリプト全体

 上記以外のデータセットの用意やロジスティック回帰の実施部分などは前回とほぼ同じです。ここまでの内容を踏まえて、コード全体としては下記のように実装しました。

# ロジスティック回帰のROC曲線

require 'daru'
require 'nyaplot'
require 'numo/narray'

Variances = [50, 150] # 両クラス共通の分散(2種類の分散で計算を実施)

def normal_rand(mu = 0, sigma = 1.0)
  random = Random.new
  (Math.sqrt(-2 * Math.log(random.rand)) * Math.sin(2 * Math::PI * random.rand) * sigma) + mu
end

# データセット {x_n,y_n,type_n} を用意
def prepare_dataset(variance)
  n1 = 80
  n2 = 200
  mu1 = [9, 9]
  mu2 = [-3, -3]

  sigma = Math.sqrt(variance)

  df1 = n1.times.map do
    [normal_rand(mu1[0], sigma), normal_rand(mu1[1], sigma)]
  end
  df1 = df1.transpose
  df1 = Daru::DataFrame.new(x: df1[0], y: df1[1], type: Array.new(n1).fill(1))

  df2 = n2.times.map do
    [normal_rand(mu2[0], sigma), normal_rand(mu2[1], sigma)]
  end
  df2 = df2.transpose
  df2 = Daru::DataFrame.new(x: df2[0], y: df2[1], type: Array.new(n2).fill(0))

  df = df1.concat(df2)
  df = df.reindex(Daru::Index.new(df.index.to_a.shuffle))
  df[:index] = (n1 + n2).times.to_a
  df.set_index(:index)
end

# ロジスティック回帰
def run_logistic(train_set, plot)
  w = Numo::NArray[[0], [0.1], [0.1]]
  phi = train_set[:x, :y]
  phi[:bias] = Array.new(phi.size).fill(1)
  t = train_set[:type]
  t = t.to_matrix

  # 最大100回のIterationを実施
  100.times do
    # IRLS法によるパラメータの修正
    y = []
    phi.each_row do |line|
      a = Vector[*line.to_a].dot(w)
      y << (1.0 / (1.0 + Math.exp(-a)))
    end
    r = Matrix.diagonal(*(Numo::NArray[*y] * (1 - Numo::NArray[*y]).to_a))
    y = Numo::NArray[y].transpose
    tmp1 = Matrix[*Numo::NArray[*phi.to_matrix.transpose.to_a].dot(Numo::NArray[*r.to_a]).dot(Numo::NArray[*phi.to_matrix.to_a]).to_a].inverse
    tmp2 = Numo::NArray[*phi.to_matrix.transpose.to_a].dot(y - Numo::NArray[*t.transpose.to_a])
    w_new = w - Numo::NArray[*tmp1.to_a].dot(tmp2)

    # パラメータの変化が 0.1% 未満になったら終了
    if (w_new - w).transpose.dot(w_new - w).flatten[0] < (0.001 * (w.transpose.dot(w))).flatten[0]
      w = w_new
      break
    end
  end

  # 分類誤差の計算と確率付きデータの用意
  d0 = w[0]
  dx = w[1]
  dy = w[2]
  err = 0
  train_set[:probability] = Array.new(train_set.size).fill(0.0)

  train_set.each_row_with_index do |line, index|
    a = Vector[1, line.x, line.y].dot(w)
    p = 1.0 / (1.0 + Math.exp(-a))
    v = train_set.row[index]
    v[:probability] = p
    train_set.set_row_at([index], v)
    if (p - 0.5) * (line[:type] * 2 - 1) < 0
      err += 1
    end
  end

  err_rate = err * 100 / train_set.size

  # 境界線(P=0.5)を表示
  xmin = train_set.x.min - 5
  xmax = train_set.x.max + 5
  linex = Numo::NArray[*(xmin.to_i-5..xmax.to_i+4).to_a]
  liney = -linex * dx / dy - d0 / dy
  label = "ERR %.2f%%" % err_rate

  line_err = plot.add(:line, linex.cast_to(Numo::Int64).to_a, liney.cast_to(Numo::Int64).to_a)
  line_err.title(label)
  line_err.color('blue')

  # 確率付きデータを返却
  sorted_train_set = train_set.sort([:probability], ascending: false)
  sorted_train_set[:index] = sorted_train_set.size.times.to_a
  sorted_train_set.set_index(:index)
end

def run_simulation(variance, plot)
  train_set = prepare_dataset(variance)
  train_set1 = train_set.filter_rows {|row| row[:type] == 1 }
  train_set2 = train_set.filter_rows {|row| row[:type] == 0 }
  ymin = train_set.y.min - 5
  xmin = train_set.x.min - 5
  ymax = train_set.y.max + 10
  xmax = train_set.x.max + 10
  plot.configure do
    x_label("Variance: #{variance}")
    y_label('')
    xrange([xmin, xmax])
    yrange([ymin, ymax])
    legend(true)
    height(300)
    width(490)
  end

  scatter_true = plot.add_with_df(train_set1.to_nyaplotdf, :scatter, :x, :y)
  scatter_true.color('green')
  scatter_true.title('1')
  scatter_false = plot.add_with_df(train_set2.to_nyaplotdf, :scatter, :x, :y)
  scatter_false.color('orange')
  scatter_false.title('0')

  run_logistic(train_set, plot)
end

def draw_roc(result, plot)
  positives = result.filter_rows {|row| row[:type] == 1 }.size
  negatives = result.filter_rows {|row| row[:type] == 0 }.size
  tp = result.size.times.map { 0.0 }
  fp = result.size.times.map { 0.0 }
  result.each_row_with_index do |line, index|
    result.size.times do |c|
      if index < c
        if line[:type] == 1
          tp[c] += 1
        else
          fp[c] += 1
        end
      end
    end
  end
  
  tp_rate = Numo::NArray[*tp] / positives
  fp_rate = Numo::NArray[*fp] / negatives

  plot.configure do
    x_label('False positive rate')
    y_label('True positive rate')
    xrange([0, 1])
    yrange([0, 1])
    height(300)
    width(400)
  end

  plot.add(:line, fp_rate, tp_rate)
end

fig = Nyaplot::Frame.new

Variances.each do |variance|
  plot = Nyaplot::Plot.new
  result = run_simulation(variance, plot)
  fig.add(plot)

  plot = Nyaplot::Plot.new
  draw_roc(result, plot)
  fig.add(plot)
end

fig.show

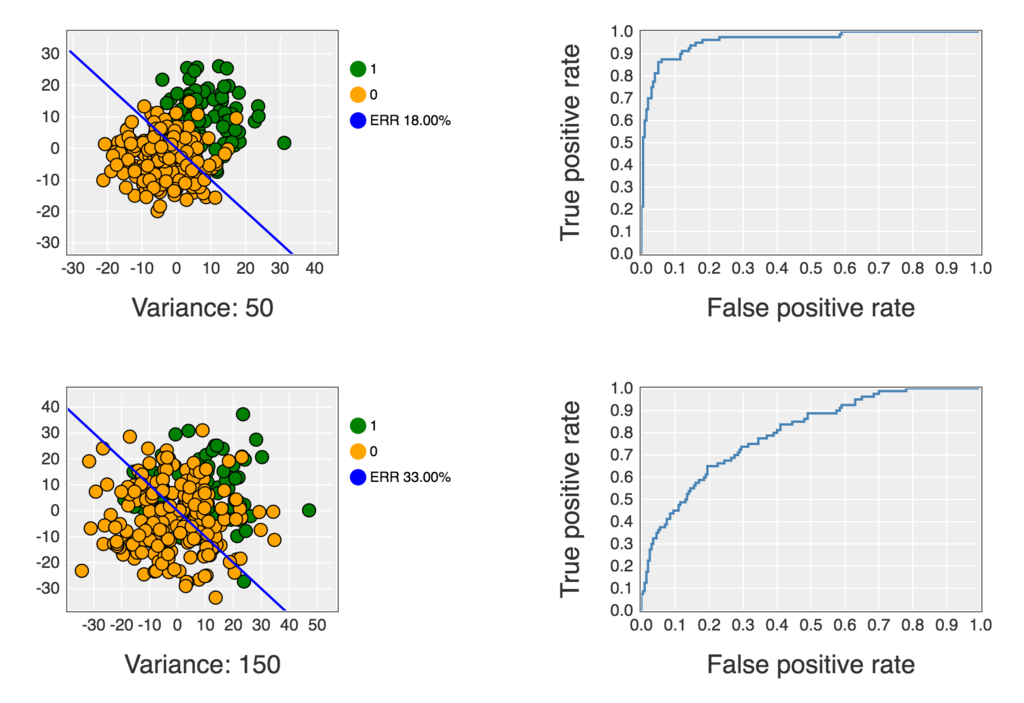
 これを Jupyter Notebook 上で実行すると下記のようなグラフが表示されます。

f:id:akanuma-hiroaki:20170130074649p:plain

 コードは下記にも公開してあります。

github.com

ロジスティック回帰とパーセプトロンの比較コード

 今回は下記書籍のロジスティック回帰とパーセプトロンの比較のコードを Ruby で実装してみたいと思います。

ITエンジニアのための機械学習理論入門 https://www.amazon.co.jp/IT-ebook/dp/B016Q22IX2/

 サンプルコードはこちらで公開されています。

github.com

ロジスティック回帰のコード

 データセットの用意やパーセプトロンのアルゴリズムの実装については前回までと基本的な内容は同じです。ロジスティック回帰のメソッドは下記のように実装しました。

def run_logistic(train_set, plot)
  w = Numo::NArray[[0], [0.1], [0.1]]
  phi = train_set[:x, :y]
  phi[:bias] = Array.new(phi.size).fill(1)
  t = train_set[:type]
  t = t.to_matrix

  # 最大30回のIterationを実施
  30.times do
    # IRLS法によるパラメータの修正
    y = []
    phi.each_row do |line|
      a = Vector[*line.to_a].dot(w)
      y << (1.0 / (1.0 + Math.exp(-a)))
    end
    r = Matrix.diagonal(*(Numo::NArray[*y] * (1 - Numo::NArray[*y]).to_a))
    y = Numo::NArray[y].transpose
    tmp1 = Matrix[*Numo::NArray[*phi.to_matrix.transpose.to_a].dot(Numo::NArray[*r.to_a]).dot(Numo::NArray[*phi.to_matrix.to_a]).to_a].inverse
    tmp2 = Numo::NArray[*phi.to_matrix.transpose.to_a].dot(y - Numo::NArray[*t.transpose.to_a])
    w_new = w - Numo::NArray[*tmp1.to_a].dot(tmp2)

    # パラメータの変化が 0.1% 未満になったら終了
    if (w_new - w).transpose.dot(w_new - w).flatten[0] < (0.001 * (w.transpose.dot(w))).flatten[0]
      w = w_new
      break
    end
  end

  # 分類誤差の計算
  w0 = w[0]
  w1 = w[1]
  w2 = w[2]
  err = 0
  train_set.each_row do |point|
    x = point.x
    y = point.y
    type = point[:type]
    type = type * 2 - 1
    if type * (w0 + w1*x + w2*y) < 0
      err += 1
    end
  end

  err_rate = err * 100 / train_set.size

  # 結果を表示
  xmin = train_set.x.min - 5
  xmax = train_set.x.max + 10
  linex = Numo::NArray[*(xmin.to_i-5..xmax.to_i+4).to_a]
  liney = -linex * w1 / w2 - w0 / w2
  label = "ERR %.2f%%" % err_rate

  line_err = plot.add(:line, linex.cast_to(Numo::Int64).to_a, liney.cast_to(Numo::Int64).to_a)
  line_err.title(label)
  line_err.color('blue')
end

内積の計算

 python では内積の計算を numpy.dot メソッドで行なっています。

numpy.dot — NumPy v1.12 Manual

高速数値計算ライブラリ「Numpy」覚書き - Pashango’s Blog

 ruby では Daru::DataFrame にはそのまま内積を計算する処理はなさそうだったので、Vectorに変換した上で dot メソッドを使いました。

instance method Vector#dot (Ruby 2.4.0)

Ruby2.2 ではアレが死ぬほど使いやすくなるの! - Qiita

a = Vector[*line.to_a].dot(w)

入力配列を対角要素とする配列

 python では numpy.diag メソッドで、入力配列を対角要素とする配列を取得しています。

numpy.diag — NumPy v1.10 Manual

r = np.diag(y*(1-y)) 

 ruby では Matrix.diagonal メソッドを使用しました。

singleton method Matrix.diagonal (Ruby 2.4.0)

r = Matrix.diagonal(*(Numo::NArray[*y] * (1 - Numo::NArray[*y]).to_a))

パラメータの計算

 python での実装は下記のようになっています。

tmp1 = np.linalg.inv(np.dot(np.dot(phi.T, r),phi))
tmp2 = np.dot(phi.T, (y-t))
w_new = w - np.dot(tmp1, tmp2)

 内積の計算用の dot メソッドや、転置行列を求める T メソッド、逆行列を求める numpy.linalog.inv メッソドなどが使われています。

 ruby で同様の処理を実装しようとしたところ、 Daru::DataFrame、 Numo::NArray、 Matrix それぞれで持っているメソッドを使うための変換処理でだいぶ煩雑になってしまいました。我ながらなんともイケてないコードです。前回までの実装もそうですが、Daru::DataFrame、Numo::NArray、Ruby標準のMatrix/Vector のどれか一つで基本的に処理することができればもっとすっきりかけるしやりようはあるのだろうと思っているのですが、まだその辺の使い方がよくわかっていません。元のpythonのコードの流れをそのままトレースするのではなく、そもそもどんな処理なのかをちゃんと理解して書く必要があるというのを改めて感じました。

tmp1 = Matrix[*Numo::NArray[*phi.to_matrix.transpose.to_a].dot(Numo::NArray[*r.to_a]).dot(Numo::NArray[*phi.to_matrix.to_a]).to_a].inverse
tmp2 = Numo::NArray[*phi.to_matrix.transpose.to_a].dot(y - Numo::NArray[*t.transpose.to_a])
w_new = w - Numo::NArray[*tmp1.to_a].dot(tmp2)

 それ以降の処理についてはパーセプトロンの場合とあまり変わらないので割愛します。

スクリプト全体

 コード全体では下記のように実装しました。

# ロジスティック回帰とパーセプトロンの比較

require 'daru'
require 'nyaplot'
require 'numo/narray'

Variances = [5, 10, 30, 50] # 両クラス共通の分散(4種類の分散で計算を実施)

class Array
  def mean
    self.inject(:+) / self.size.to_f
  end
end

def normal_rand(mu = 0, sigma = 1.0)
  random = Random.new
  (Math.sqrt(-2 * Math.log(random.rand)) * Math.sin(2 * Math::PI * random.rand) * sigma) + mu
end

# データセット {x_n,y_n,type_n} を用意
def prepare_dataset(variance)
  n1 = 10
  n2 = 20
  mu1 = [7, 7]
  mu2 = [-3, -3]

  sigma = Math.sqrt(variance)

  df1 = n1.times.map do
    [normal_rand(mu1[0], sigma), normal_rand(mu1[1], sigma)]
  end
  df1 = df1.transpose
  df1 = Daru::DataFrame.new(x: df1[0], y: df1[1], type: Array.new(n1).fill(1))

  df2 = n2.times.map do
    [normal_rand(mu2[0], sigma), normal_rand(mu2[1], sigma)]
  end
  df2 = df2.transpose
  df2 = Daru::DataFrame.new(x: df2[0], y: df2[1], type: Array.new(n2).fill(0))

  df = df1.concat(df2)
  df = df.reindex(Daru::Index.new(df.index.to_a.shuffle))
  df[:index] = (n1 + n2).times.to_a
  df.set_index(:index)
end

# ロジスティック回帰
def run_logistic(train_set, plot)
  w = Numo::NArray[[0], [0.1], [0.1]]
  phi = train_set[:x, :y]
  phi[:bias] = Array.new(phi.size).fill(1)
  t = train_set[:type]
  t = t.to_matrix

  # 最大30回のIterationを実施
  30.times do
    # IRLS法によるパラメータの修正
    y = []
    phi.each_row do |line|
      a = Vector[*line.to_a].dot(w)
      y << (1.0 / (1.0 + Math.exp(-a)))
    end
    r = Matrix.diagonal(*(Numo::NArray[*y] * (1 - Numo::NArray[*y]).to_a))
    y = Numo::NArray[y].transpose
    tmp1 = Matrix[*Numo::NArray[*phi.to_matrix.transpose.to_a].dot(Numo::NArray[*r.to_a]).dot(Numo::NArray[*phi.to_matrix.to_a]).to_a].inverse
    tmp2 = Numo::NArray[*phi.to_matrix.transpose.to_a].dot(y - Numo::NArray[*t.transpose.to_a])
    w_new = w - Numo::NArray[*tmp1.to_a].dot(tmp2)

    # パラメータの変化が 0.1% 未満になったら終了
    if (w_new - w).transpose.dot(w_new - w).flatten[0] < (0.001 * (w.transpose.dot(w))).flatten[0]
      w = w_new
      break
    end
  end

  # 分類誤差の計算
  w0 = w[0]
  w1 = w[1]
  w2 = w[2]
  err = 0
  train_set.each_row do |point|
    x = point.x
    y = point.y
    type = point[:type]
    type = type * 2 - 1
    if type * (w0 + w1*x + w2*y) < 0
      err += 1
    end
  end

  err_rate = err * 100 / train_set.size

  # 結果を表示
  xmin = train_set.x.min - 5
  xmax = train_set.x.max + 10
  linex = Numo::NArray[*(xmin.to_i-5..xmax.to_i+4).to_a]
  liney = -linex * w1 / w2 - w0 / w2
  label = "ERR %.2f%%" % err_rate

  line_err = plot.add(:line, linex.cast_to(Numo::Int64).to_a, liney.cast_to(Numo::Int64).to_a)
  line_err.title(label)
  line_err.color('blue')
end

# パーセプトロン
def run_perceptron(train_set, plot)
  w0 = 0.0
  w1 = 0.0
  w2 = 0.0
  bias = 0.5 * (train_set.x.mean + train_set.y.mean)

  # Iterationを30回実施
  30.times do
    # 確率的勾配降下法によるパラメータの修正
    train_set.each_row do |point|
      x = point.x
      y = point.y
      type = point[:type]
      type = type * 2 - 1
      if type * (w0*bias + w1*x + w2*y) <= 0
        w0 += type * bias
        w1 += type * x
        w2 += type * y
      end
    end
  end

  # 分類誤差の計算
  err = 0
  train_set.each_row do |point|
    x = point.x
    y = point.y
    type = point[:type]
    type = type * 2 - 1
    if type * (w0*bias + w1*x + w2*y) <= 0
      err += 1
    end
  end

  err_rate = err * 100 / train_set.size

  # 結果を表示
  xmin = train_set.x.min - 5
  xmax = train_set.x.max + 10
  linex = Numo::NArray[*(xmin.to_i-5..xmax.to_i+4).to_a]
  liney = -linex * w1 / w2 - bias * w0 / w2
  label = "ERR %.2f%%" % err_rate

  line_err = plot.add(:line, linex.cast_to(Numo::Int64).to_a, liney.cast_to(Numo::Int64).to_a)
  line_err.title(label)
  line_err.color('red')
end

def run_simulation(variance, plot)
  train_set = prepare_dataset(variance)
  train_set1 = train_set.filter_rows {|row| row[:type] == 1 }
  train_set2 = train_set.filter_rows {|row| row[:type] == 0 }
  ymin = train_set.y.min - 5
  xmin = train_set.x.min - 5
  ymax = train_set.y.max + 10
  xmax = train_set.x.max + 10
  plot.configure do
    x_label("Variance: #{variance}")
    y_label('')
    xrange([xmin, xmax])
    yrange([ymin, ymax])
    legend(true)
    height(300)
    width(490)
  end

  scatter_true = plot.add_with_df(train_set1.to_nyaplotdf, :scatter, :x, :y)
  scatter_true.color('green')
  scatter_true.title('1')
  scatter_false = plot.add_with_df(train_set2.to_nyaplotdf, :scatter, :x, :y)
  scatter_false.color('orange')
  scatter_false.title('0')

  run_logistic(train_set, plot)
  run_perceptron(train_set, plot)
end

fig = Nyaplot::Frame.new

Variances.each do |variance|
  plot = Nyaplot::Plot.new
  run_simulation(variance, plot)
  fig.add(plot)
end

fig.show

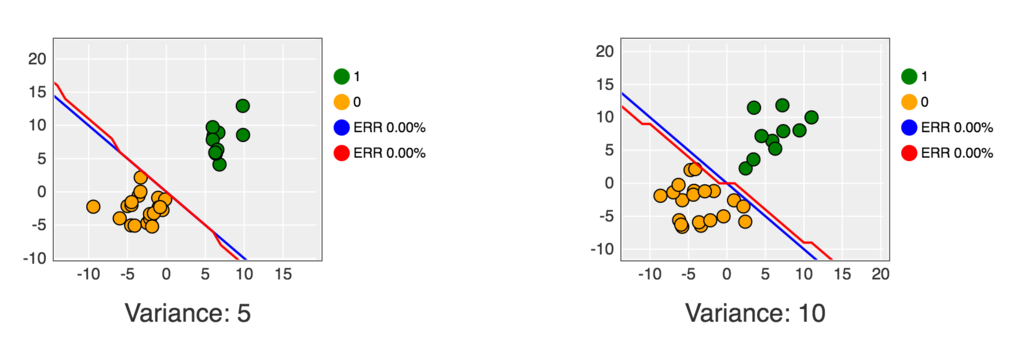
 これを Jupyter Notebook 上で実行すると下記のようなグラフが表示されます。

f:id:akanuma-hiroaki:20170126073424p:plain

f:id:akanuma-hiroaki:20170126073442p:plain

 python版と比べるとロジスティック回帰の優位性が見えにくい結果になっている気がするので、どこか実装に間違いがある可能性もあるかなと思っていますが、ひとまず近い形のグラフの表示までは行けた形です。もし、ここが違っている、とお気付きの方はコメントいただけると嬉しいです。

 コードは下記にも公開しました。

github.com

パーセプトロンによる二項分類のコード

 今回は下記書籍のパーセプトロンによる二項分類のコードを Ruby で実装してみたいと思います。

ITエンジニアのための機械学習理論入門
https://www.amazon.co.jp/IT-ebook/dp/B016Q22IX2/www.amazon.co.jp

 サンプルコードはこちらで公開されています。

github.com

データセットの用意

 サンプルコードでは下記のようにデータセットを用意するためのコードが実装されています。

N1 = 20         # クラス t=+1 のデータ数
Mu1 = [15,10]   # クラス t=+1 の中心座標

N2 = 30         # クラス t=-1 のデータ数
Mu2 = [0,0]     # クラス t=-1 の中心座標

Variances = [15,30] # 両クラス共通の分散(2種類の分散で計算を実施)

# データセット {x_n,y_n,type_n} を用意
def prepare_dataset(variance):
    cov1 = np.array([[variance,0],[0,variance]])
    cov2 = np.array([[variance,0],[0,variance]])

    df1 = DataFrame(multivariate_normal(Mu1,cov1,N1),columns=['x','y'])
    df1['type'] = 1
    df2 = DataFrame(multivariate_normal(Mu2,cov2,N2),columns=['x','y'])
    df2['type'] = -1 
    df = pd.concat([df1,df2],ignore_index=True)
    df = df.reindex(np.random.permutation(df.index)).reset_index(drop=True)
    return df

 このコードの目的としては、クラス t = +1 のデータと t = -1 のデータが混在したデータセットを返すことで、 クラス t = +1 は {x, y} = {15, 10} を中心とし、クラス t = -1 は {x, y} = {0, 0} を中心とした、 分散15もしくは30の場合の二次元正規分布乱数のセットです。

 処理の内容としては、 multivariate_normal メソッドで二次元正規分布乱数の配列を生成して それぞれのクラス用のDataFrameを用意し、結合してランダムにシャッフルしてインデックスを振り直しています。

 multivariate_normal は平均の配列と共分散行列を引数に取り、多次元正規分布乱数を生成してくれます。

numpy.random.multivariate_normal — NumPy v1.11 Manual

 こちらも参考にしました。

3次元正規分布を Axes3D で描画-python | コード7区

 今回のケースでは平均の配列としてそれぞれのクラスの x, y の中心座標値を渡しており、 共分散行列としてはどちらも共通で [[variance,0],[0,variance]] という 2 x 2 行列を渡しています。 この場合対角成分であるvarianceはそれぞれxの分散、yの分散ということになり、 また、xyの共分散は0ということになりますのでxとyの間に相関はないということを表しているという理解です。

 最初は multivariate_normal に該当する処理をrubyで探したものの、ライブラリ等は見つからず、 自前実装にも multivariate_normal の内容の理解が足りなかったのですが、今回のケースであれば、 xyに相関はなく、xとyで独立して正規分布乱数を生成すれば問題ないのではないかと思ったので、 下記のようにデータセット生成処理を実装しました。

N1 = 20
Mu1 = [15, 10]

N2 = 30
Mu2 = [0, 0]

def normal_rand(mu = 0, sigma = 1.0)
  random = Random.new
  (Math.sqrt(-2 * Math.log(random.rand)) * Math.sin(2 * Math::PI * random.rand) * sigma) + mu
end

# データセット {x_n,y_n,type_n} を用意
def prepare_dataset(variance)
  sigma = Math.sqrt(variance)

  df1 = N1.times.map do
    [normal_rand(Mu1[0], sigma), normal_rand(Mu1[1], sigma)]
  end
  df1 = df1.transpose
  df1 = Daru::DataFrame.new(x: df1[0], y: df1[1], type: Array.new(N1).fill(1))

  df2 = N2.times.map do
    [normal_rand(Mu2[0], sigma), normal_rand(Mu2[1], sigma)]
  end
  df2 = df2.transpose
  df2 = Daru::DataFrame.new(x: df2[0], y: df2[1], type: Array.new(N2).fill(-1))

  df = df1.concat(df2)
  df = df.reindex(Daru::Index.new(df.index.to_a.shuffle))
  df[:index] = (N1 + N2).times.to_a
  df.set_index(:index)
end

 normal_rand メソッドは前回まででも実装した内容と同じで、正規分布の乱数を生成します。引数としては平均と標準偏差を取ります。 prepare_database メソッドに渡される variance は分散なので、平方根を求めて偏差 sigma として normal_rand に渡しています。

Perceptronのアルゴリズム(確率的勾配降下法)を実行

 該当メソッドのコードとしては下記のように実装しました。

まずはデータセットのプロット部分。

# Perceptronのアルゴリズム(確率的勾配降下法)を実行
def run_simulation(variance)
  data_graph = Nyaplot::Plot.new
  param_graph = Nyaplot::Plot.new

  train_set = prepare_dataset(variance)
  train_set1 = train_set.filter_rows {|row| row[:type] == 1 }
  train_set2 = train_set.filter_rows {|row| row[:type] == -1 }
  ymin = train_set.y.min - 5
  xmin = train_set.x.min - 5
  ymax = train_set.y.max + 10
  xmax = train_set.x.max + 10
  data_graph.configure do
    x_label('')
    y_label('')
    xrange([xmin, xmax])
    yrange([ymin, ymax])
    legend(true)
    height(300)
    width(490)
  end

  scatter_true = data_graph.add_with_df(train_set1.to_nyaplotdf, :scatter, :x, :y)
  scatter_true.color('green')
  scatter_true.title('1')
  scatter_false = data_graph.add_with_df(train_set2.to_nyaplotdf, :scatter, :x, :y)
  scatter_false.color('orange')
  scatter_false.title('-1')

 データセットから filter_rows メソッドでクラス t = 1 のセットとクラス t = -1 のセットに分け、 それぞれのセットのデータを一つの図にプロットしています。

 次に確率的勾配降下法による処理で30回のIterationを回して各パラメータを決定している部分です。

  # パラメータの初期値とbias項の設定
  w0 = 0.0
  w1 = 0.0
  w2 = 0.0
  bias = 0.5 * (train_set.x.mean + train_set.y.mean)
    
  # Iterationを30回実施
  paramhist = Daru::DataFrame.new(w0: [w0], w1: [w1], w2: [w2])
  10.times do
    train_set.each_row do |point|
      x = point.x
      y = point.y
      type = point[:type]
      if type * (w0*bias + w1*x + w2*y) <= 0
        w0 += type * bias
        w1 += type * x
        w2 += type * y
      end
    end
    paramhist.add_row(Daru::Vector.new([w0, w1, w2], index: [:w0, :w1, :w2]))
  end

 各パラメータの初期値を入れたDataFrameを用意しておき、Iterationごとにadd_rowで各パラメータ値をVectorとして追加しています。

 そして次にその結果について判定誤差の割合を計算します。

  # 判定誤差の計算
  err = 0
  train_set.each_row do |point|
    x = point.x
    y = point.y
    type = point[:type]
    if type * (w0*bias + w1*x + w2*y) <= 0
      err += 1
    end
  end
  
  err_rate = err * 100 / train_set.size

 決定されたパラメータでデータセットの各値に対して判定を行い、エラーになった数の割合を計算しています。

 そして最後にここまでの結果をグラフに表示します。

  # 結果の表示
  linex = Numo::NArray[*(xmin.to_i-5..xmax.to_i+4).to_a]
  liney = -linex * w1 / w2 - bias * w0 / w2
  label = "ERR %.2f%%" % err_rate
  line_err = data_graph.add(:line, linex.cast_to(Numo::Int64).to_a, liney.cast_to(Numo::Int64).to_a)
  line_err.title(label)
  line_err.color('red')
  line_w0 = param_graph.add(:line, paramhist.index.to_a, paramhist.w0)
  line_w0.title('w0')
  line_w0.color('blue')
  line_w1 = param_graph.add(:line, paramhist.index.to_a, paramhist.w1)
  line_w1.title('w1')
  line_w1.color('green')
  line_w2 = param_graph.add(:line, paramhist.index.to_a, paramhist.w2)
  line_w2.title('w2')
  line_w2.color('red')
  
  param_graph.configure do
    x_label('')
    y_label('')
    legend(true)
    height(300)
    width(490)
  end

  [data_graph, param_graph]
end

 元の python のコードでは、 linex を numpy.arange メソッドを使って numpy.ndarray クラスのオブジェクトとして取得しています。 numpy.ndarray は 多次元配列を扱うためのクラスです。

numpy.ndarray — NumPy v1.12 Manual

 ruby では同様のことを行うために、下記サイトを参考にして NArray を使用しました。

Numerical Ruby NArray

github.com

 linex を NArray のオブジェクトとして生成し、各パラメータ値による計算を行い、liney を求めています。

 NArrayではオブジェクトが生成されるときに各値のデータ型は自動的に判定されます。今回のケースでは Numo::Int32 として判定されたのですが、そのオブジェクトを to_a で通常の配列に変換すると正しく変換されなかったため、一旦 Numo::Int64 に変換した上で配列に変換しました。

irb(main):024:0* Numo::NArray[-3, -2, -1, 0, 1, 2, 3]
=> Numo::Int32#shape=[7]
[-3, -2, -1, 0, 1, 2, 3]
irb(main):025:0> Numo::NArray[-3, -2, -1, 0, 1, 2, 3].to_a
=> [4294967293, 4294967294, 4294967295, 0, 1, 2, 3]
irb(main):026:0> Numo::NArray[-3, -2, -1, 0, 1, 2, 3].cast_to(Numo::Int64).to_a
=> [-3, -2, -1, 0, 1, 2, 3]

スクリプト全体

 スクリプト全体としては下記のようになります。

require 'daru'
require 'nyaplot'
require 'numo/narray'

N1 = 20
Mu1 = [15, 10]

N2 = 30
Mu2 = [0, 0]

Variances = [15, 30]

class Array
  def mean
    self.inject(:+) / self.size.to_f
  end
end

def normal_rand(mu = 0, sigma = 1.0)
  random = Random.new
  (Math.sqrt(-2 * Math.log(random.rand)) * Math.sin(2 * Math::PI * random.rand) * sigma) + mu
end

# データセット {x_n,y_n,type_n} を用意
def prepare_dataset(variance)
  sigma = Math.sqrt(variance)

  df1 = N1.times.map do
    [normal_rand(Mu1[0], sigma), normal_rand(Mu1[1], sigma)]
  end
  df1 = df1.transpose
  df1 = Daru::DataFrame.new(x: df1[0], y: df1[1], type: Array.new(N1).fill(1))

  df2 = N2.times.map do
    [normal_rand(Mu2[0], sigma), normal_rand(Mu2[1], sigma)]
  end
  df2 = df2.transpose
  df2 = Daru::DataFrame.new(x: df2[0], y: df2[1], type: Array.new(N2).fill(-1))

  df = df1.concat(df2)
  df = df.reindex(Daru::Index.new(df.index.to_a.shuffle))
  df[:index] = (N1 + N2).times.to_a
  df.set_index(:index)
end

# Perceptronのアルゴリズム(確率的勾配降下法)を実行
def run_simulation(variance)
  data_graph = Nyaplot::Plot.new
  param_graph = Nyaplot::Plot.new

  train_set = prepare_dataset(variance)
  train_set1 = train_set.filter_rows {|row| row[:type] == 1 }
  train_set2 = train_set.filter_rows {|row| row[:type] == -1 }
  ymin = train_set.y.min - 5
  xmin = train_set.x.min - 5
  ymax = train_set.y.max + 10
  xmax = train_set.x.max + 10
  data_graph.configure do
    x_label('')
    y_label('')
    xrange([xmin, xmax])
    yrange([ymin, ymax])
    legend(true)
    height(300)
    width(490)
  end

  scatter_true = data_graph.add_with_df(train_set1.to_nyaplotdf, :scatter, :x, :y)
  scatter_true.color('green')
  scatter_true.title('1')
  scatter_false = data_graph.add_with_df(train_set2.to_nyaplotdf, :scatter, :x, :y)
  scatter_false.color('orange')
  scatter_false.title('-1')
  
  # パラメータの初期値とbias項の設定
  w0 = 0.0
  w1 = 0.0
  w2 = 0.0
  bias = 0.5 * (train_set.x.mean + train_set.y.mean)
    
  # Iterationを30回実施
  paramhist = Daru::DataFrame.new(w0: [w0], w1: [w1], w2: [w2])
  30.times do
    train_set.each_row do |point|
      x = point.x
      y = point.y
      type = point[:type]
      if type * (w0*bias + w1*x + w2*y) <= 0
        w0 += type * bias
        w1 += type * x
        w2 += type * y
      end
    end
    paramhist.add_row(Daru::Vector.new([w0, w1, w2], index: [:w0, :w1, :w2]))
  end
  
  # 判定誤差の計算
  err = 0
  train_set.each_row do |point|
    x = point.x
    y = point.y
    type = point[:type]
    if type * (w0*bias + w1*x + w2*y) <= 0
      err += 1
    end
  end
  
  err_rate = err * 100 / train_set.size
  
  # 結果の表示
  linex = Numo::NArray[*(xmin.to_i-5..xmax.to_i+4).to_a]
  liney = -linex * w1 / w2 - bias * w0 / w2
  label = "ERR %.2f%%" % err_rate
  line_err = data_graph.add(:line, linex.cast_to(Numo::Int64).to_a, liney.cast_to(Numo::Int64).to_a)
  line_err.title(label)
  line_err.color('red')
  line_w0 = param_graph.add(:line, paramhist.index.to_a, paramhist.w0)
  line_w0.title('w0')
  line_w0.color('blue')
  line_w1 = param_graph.add(:line, paramhist.index.to_a, paramhist.w1)
  line_w1.title('w1')
  line_w1.color('green')
  line_w2 = param_graph.add(:line, paramhist.index.to_a, paramhist.w2)
  line_w2.title('w2')
  line_w2.color('red')
  
  param_graph.configure do
    x_label('')
    y_label('')
    legend(true)
    height(300)
    width(490)
  end

  [data_graph, param_graph]
end

fig = Nyaplot::Frame.new

Variances.each do |variance|
  data_graph, param_graph = run_simulation(variance)
  fig.add(data_graph)
  fig.add(param_graph)
end

fig.show

 これを Jupyter Notebook 上で実行すると下記のようなグラフが表示されます。

f:id:akanuma-hiroaki:20170118083001p:plain

 書籍のサンプルと近い形になっているのであっていそうな気はしていますが、今回は特に理解が怪しいので、間違いなどありましたらご指摘いただければと思います。

 コードは下記にも公開しました。

github.com