推定量の一致性と不偏性の確認コード

 今回は下記書籍の推定量の一致性と不偏性の確認のサンプルコードをRubyで実装してみたいと思います。

ITエンジニアのための機械学習理論入門 | 中井悦司 | 工学 | Kindleストア | Amazon

 サンプルコードはこちらで公開されています。

github.com

算術平均メソッド

 RubyではArrayの平均を計算するメソッドが用意されていないので、配列内の値を合計したものを要素数で割って平均を取得するのですが、今回は平均を使う回数が多かったので、Arrayクラスのメソッドとして実装しました。

class Array
  def mean
    self.inject(:+) / self.size.to_f
  end
end

 Arrayの中身が数値であること前提の実装ですが、今回の用途としてはこれで十分なので最低限の実装にしてあります。

配列データの取り出し

 Pythonのコードでは下記のように実装されています。

raw_linex[0:-1:50]

 これは、下記のような指定になっています。

配列名[始点インデックス:終端インデックス:ステップ]

 インデックスにマイナスの値を指定すると配列末尾からの指定になりますので、「raw_linexという配列の先頭から末尾までを50ステップごとに取り出す」という指定になります。

 Ruby では上記のようなシンタックスは用意されていないようだったので、下記サイトを参考に、Array#values_at を使用して実装しました。

stackoverflow.com

def thin_out_data(array)
  array.values_at(*(0...array.size-1).step(50))
end

 Rangeとして配列の先頭から末尾のインデックスになるように指定し、step で50おきに取り出し、アスタリスク付きでメソッドに渡すことでそれを展開した形で渡しています。

スクリプト全体

 ここまでの内容を踏まえて、スクリプト全体としては下記のように実装しました。

# 推定量の一致性と不偏性の確認

require 'nyaplot'

class Array
  def mean
    self.inject(:+) / self.size.to_f
  end
end

def normal_rand(mu = 0, sigma = 1.0)
  random = Random.new
  (Math.sqrt(-2 * Math.log(random.rand)) * Math.sin(2 * Math::PI * random.rand) * sigma) + mu
end

def thin_out_data(array)
  array.values_at(*(0...array.size-1).step(50))
end

def draw_plot(linex1, liney1, linex2, liney2, label, ylim)
  plot = Nyaplot::Plot.new
  df = Nyaplot::DataFrame.new(x: linex1, y: liney1)
  scatter = plot.add_with_df(df, :scatter, :x, :y)
  scatter.color('blue')
  scatter.title('data')
  line = plot.add(:line, linex2, liney2)
  line.color('red')
  line.title('mean')

  plot.configure do
    x_label(label)
    y_label('')
    xrange([linex1.min, linex1.max + 1])
    yrange(ylim)
    legend(true)
  end
end

mean_linex = []
mean_mu = []
mean_s2 = []
mean_u2 = []
raw_linex = []
raw_mu = []
raw_s2 = []
raw_u2 = []

(2..50).each do |n| # 観測データ数Nを変化させて実行
  2000.times do # 特定のNについて2000回の推定を繰り返す
    ds = n.times.map { normal_rand }
    raw_mu << ds.mean
    sum_of_squares = ds.inject(0) {|sum, i| sum + (i - ds.mean) ** 2 }
    var = sum_of_squares / ds.size.to_f
    raw_s2 << var
    raw_u2 << var * n / (n - 1)
    raw_linex << n
  end

  mean_mu << raw_mu.mean # 標本平均の平均
  mean_s2 << raw_s2.mean # 標本分散の平均
  mean_u2 << raw_u2.mean # 不偏分散の平均
  mean_linex << n
end

# プロットデータを40個に間引きする
raw_linex = thin_out_data(raw_linex)
raw_mu = thin_out_data(raw_mu)
raw_s2 = thin_out_data(raw_s2)
raw_u2 = thin_out_data(raw_u2)

fig = Nyaplot::Frame.new

# 標本平均の結果表示
plot = draw_plot(raw_linex, raw_mu, mean_linex, mean_mu, 'Sample mean', [-1.5, 1.5])
fig.add(plot)

# 標本分散の結果表示
plot = draw_plot(raw_linex, raw_s2, mean_linex, mean_s2, 'Sample variance', [-0.5, 3.0])
fig.add(plot)

# 不偏分散の結果表示
plot = draw_plot(raw_linex, raw_u2, mean_linex, mean_u2, 'Unbiased variance', [-0.5, 3.0])
fig.add(plot)

fig.show

 これを Jupyter Notebook 上で実行すると下記のようなグラフが描画されます。

f:id:akanuma-hiroaki:20170106072922p:plain

f:id:akanuma-hiroaki:20170106072939p:plain

f:id:akanuma-hiroaki:20170106072953p:plain

 コードは下記にも公開してあります。

github.com

最尤推定による正規分布の推定コード

 今回は下記書籍の最尤推定による正規分布の推定のサンプルコードをRubyで実装してみたいと思います。

ITエンジニアのための機械学習理論入門

 サンプルコードはこちらで公開されています。

github.com

算術平均

 python では numpy.mean を使って配列に含まれる値の算術平均を取得できます。

numpy.mean
https://docs.scipy.org/doc/numpy/reference/generated/numpy.mean.html

>>> array
[1, 2, 3, 4, 5, 6, 7, 8, 9, 10]
>>> numpy.mean(array)
5.5

 ruby では同様のメソッドがみつからなかったので、配列内の値を合計したものを要素数で割って平均を取得します。

irb(main):020:0* array                              
=> [1, 2, 3, 4, 5, 6, 7, 8, 9, 10]
irb(main):021:0> array.inject(:+) / array.size.to_f
=> 5.5

分散

 python で分散を算出するには numpy.var を使用します。

numpy.var
https://docs.scipy.org/doc/numpy/reference/generated/numpy.var.html

>>> array
[1, 2, 3, 4, 5, 6, 7, 8, 9, 10]
>>> numpy.var(array)
8.25                

 こちらも ruby ではメソッドがみつからなかったので、下記サイトを参考にさせていただきました。

Rubyで標本の分散・標準偏差・変動係数算出まで | WEBサービス創造記

 平均、偏差平方和を算出し、要素数で割って分散を算出しています。

irb(main):044:0* array
=> [1, 2, 3, 4, 5, 6, 7, 8, 9, 10]
irb(main):045:0> mean = array.inject(:+) / array.size.to_f                         
=> 5.5
irb(main):046:0> sum_of_squares = array.inject(0) {|sum, i| sum + (i - mean) ** 2} 
=> 82.5
irb(main):047:0> sum_of_squares / array.size.to_f                                  
=> 8.25

等間隔の数値配列生成

 ある一定範囲内で、指定したステップごとの数値の配列の取得は、 python では numpy.arrange を利用します。

numpy.arange
https://docs.scipy.org/doc/numpy/reference/generated/numpy.arange.html

>>> numpy.arange(-10, 10, 2)                             
array([-10,  -8,  -6,  -4,  -2,   0,   2,   4,   6,   8])

 ruby では範囲オブジェクトと step メソッドを利用して生成します。

irb(main):059:0* s = 2
=> 2
irb(main):060:0> (-10..10-s).step(s).to_a
=> [-10, -8, -6, -4, -2, 0, 2, 4, 6, 8]

確率密度関数

 python では確率密度関数の利用は scipy.stats.norm から行います。

scipy.stats.norm
https://docs.scipy.org/doc/scipy-0.16.1/reference/generated/scipy.stats.norm.html

>>> from scipy.stats import norm
>>> orig = norm(loc=0, scale=1)
>>> orig                                                              
<scipy.stats._distn_infrastructure.rv_frozen object at 0x7f095ae1b950>
>>> linex = numpy.arange(-10, 10, 2)                     
>>> linex                                                
array([-10,  -8,  -6,  -4,  -2,   0,   2,   4,   6,   8])
>>> orig.pdf(linex)                                         
array([  7.69459863e-23,   5.05227108e-15,   6.07588285e-09,
         1.33830226e-04,   5.39909665e-02,   3.98942280e-01,
         5.39909665e-02,   1.33830226e-04,   6.07588285e-09,
         5.05227108e-15])                                   

 ruby では rubystats という gem があったので、そちらを使ってみます。

github.com

Distribution::Normal というのもあるのですが、こちらは平均と標準偏差がそれぞれ 0, 1 のケースにしか適用できなかったので、 rubystats を使うことにしました。

Distribution http://www.rubydoc.info/github/sciruby/distribution

irb(main):002:0* require 'rubystats/normal_distribution'
=> true
irb(main):003:0> norm = Rubystats::NormalDistribution.new(0, 1)
=> #<Rubystats::NormalDistribution:0x007f6dfa935930 @mean=0, @stdev=1, @variance=1, @pdf_denominator=2.5066282746310007, @cdf_denominator=1.4142135623730951, @use_last=nil>
irb(main):004:0> s = 2
=> 2
irb(main):005:0> linex = (-10..10-s).step(s).to_a
=> [-10, -8, -6, -4, -2, 0, 2, 4, 6, 8]
irb(main):006:0> linex.map {|x| norm.pdf(x) }
=> [7.694598626706419e-23, 5.052271083536892e-15, 6.075882849823285e-09, 0.00013383022576488534, 0.05399096651318805, 0.39894228040143265, 0.05399096651318805, 0.00013383022576488534, 6.075882849823285e-09, 5.052271083536892e-15]

スクリプト全体

 ここまでの内容を踏まえて、スクリプト全体としては下記のように実装しました。

require 'nyaplot'
require 'rubystats/normal_distribution'

def normal_rand(mu = 0, sigma = 1.0)
  random = Random.new
  (Math.sqrt(-2 * Math.log(random.rand)) * Math.sin(2 * Math::PI * random.rand) * sigma) + mu
end

fig = Nyaplot::Frame.new

[2,4,10,100].each do |datapoints|
  ds = datapoints.times.map { normal_rand }

  mu = ds.inject(:+) / ds.size.to_f
  sum_of_squares = ds.inject(0) {|sum, i| sum + (i - mu) ** 2} 
  var = sum_of_squares / ds.size.to_f
  sigma = Math.sqrt(var)

  plot = Nyaplot::Plot.new

  s = 0.1
  linex = (-10..10-s).step(s).to_a
  
  # 真の曲線を表示
  orig = Rubystats::NormalDistribution.new(0, 1)  
  orig_pdfs = linex.map {|x| orig.pdf(x) }
  line = plot.add(:line, linex, orig_pdfs)
  line.color('green')
  line.title('Original')

  # 推定した曲線を表示
  est = Rubystats::NormalDistribution.new(mu, Math.sqrt(sigma))
  est_pdfs = linex.map {|x| est.pdf(x)}
  line = plot.add(:line, linex, est_pdfs)
  line.color('red')
  line.title("Sigma=#{sprintf("%.2f", sigma)}")
  
  # サンプルの表示
  df = Nyaplot::DataFrame.new({x: ds,y: ds.map {|x| orig.pdf(x)}})
  scatter = plot.add_with_df(df, :scatter, :x, :y)
  scatter.color('blue')
  scatter.title('Sample')

  fig.add(plot)
  
  plot.configure do
    x_label("N=#{datapoints}")
    y_label('')
    xrange([-4, 4])
    legend(true)
    height(300)
    width(490)
  end
end

fig.show

 実行すると Jupyter Notebook で実行すると下記のようなグラフが表示されます。

f:id:akanuma-hiroaki:20161230132326p:plain

 コードは下記にも公開しています。

github.com

Amazon Dash Button を押したら Slack にポストする(RxRuby版)

 前回の投稿で、 Amazon Dash Button を押したら Slack にポストする記事を書いたのですが、Facebookでシェアしたところ、「イベントハンドリングのところで、RxRubyあたりを使うとクールに実装できそうです。」というコメントをいただいたので、RxRubyを使う版を試してみました。

RxRuby

 RxRuby は Reactive Extensions の Ruby用ライブラリです。最終の更新からしばらく経っているようですが、使わせてもらうことにしました。

github.com

 ググってみたところ、RxRubyについてはあまり記事は多くなかったのですが、こちらのブログを参考にさせていただきました。

qiita.com

 Reactive Extensions については私も今回初めて調べたので、詳しいことは語れませんが、GoFのデザインパターンのオブザーバーパターンを表したもので、非同期にイベント駆動で処理を行うためのモデルと解釈しています。詳しい内容についてはReactive Extensionsの公式ページを参照していただくと良いかと思います。

ReactiveX

Dash Button のMACアドレス確認

 やろうとしていることは前回記事と同じですが、RxRubyを使うようにコードを変更してみました。

capture_rx.rb

require 'packetfu'
require 'rx'
require './ouis.rb'
include PacketFu

class Rx::BehaviorSubject
  public :check_unsubscribed
end

def get_capture(iface)
  subject = Rx::Subject.new
  subject.select {|pkt| dash_packet?(pkt) }.subscribe(
    lambda {|pkt| capture(pkt) },
    lambda {|err| puts "Error: #{err}" },
    lambda { puts 'Completed.' }
  )

  cap = Capture.new(iface: iface, start: true)
  cap.stream.each do |pkt|
    subject.on_next pkt
  end
end

def dash_packet?(pkt)
  return false unless EthPacket.can_parse?(pkt)
  get_vendor_name(EthHeader.str2mac(EthPacket.parse(pkt).eth_src)).downcase.include?('amazon')
end

def capture(pkt)
  time = Time.now.strftime("%Y-%m-%d %H:%M:%S.%6N")

  if UDPPacket.can_parse?(pkt)
    packet = UDPPacket.parse(pkt)
    src_ip = IPHeader.octet_array(packet.ip_src).join('.')
    dst_ip = IPHeader.octet_array(packet.ip_dst).join('.')
    protocol = 'udp'
  elsif ARPPacket.can_parse?(pkt)
    packet = ARPPacket.parse(pkt)
    src_ip = packet.arp_saddr_ip
    dst_ip = packet.arp_daddr_ip
    protocol = 'arp'
  else
    return
  end

  src_mac, dst_mac, vendor_name = get_common_values(packet)
  output(time, src_mac, dst_mac, src_ip, dst_ip, protocol, vendor_name)
end

def output(time, src_mac, dst_mac, src_ip, dst_ip, protocol, vendor_name)
  puts "time:#{time}, src_mac:#{src_mac}, dst_mac:#{dst_mac}, src_ip:#{src_ip}, dst_ip:#{dst_ip}, protocol:#{protocol}, vendor:#{vendor_name}"
end

def get_common_values(packet)
  src_mac = EthHeader.str2mac(packet.eth_src)
  dst_mac = EthHeader.str2mac(packet.eth_dst)
  vendor_name = get_vendor_name(src_mac)
  return src_mac, dst_mac, vendor_name
end

def get_vendor_name(mac)
  return '' if mac.nil?
  oui = mac.split(':').slice(0, 3).join('-')
  OUIS[oui.upcase]
end

if $0 == __FILE__
  iface = ARGV[0]
  puts "Capturing for interface: #{iface}"
  get_capture(iface)
end

 キャプチャしたパケットをRxRubyで作ったストリームに放り込み、selectでダッシュボタンからのパケットのみフィルタリングしています。パケットの内容を出力する処理は subscribe で渡す lambda の中に定義しました。

Dash Button からの通信を検知して Slack に投稿する

 こちらもやろうとしてることは前回と同じですが、RxRubyを使うように変更しています。

post_to_slack_rx.rb

require 'packetfu'
require 'open3'
require 'json'
require 'rx'
include PacketFu

FILTER = nil
MAC_OF_DASH = 'Dash Button の MACアドレス'
SLACK_API_URL = 'Slack Incoming Webhook URL'
INTERVAL_SECONDS = 2

class Rx::BehaviorSubject
  public :check_unsubscribed
end

def get_capture(iface)
  subject = Rx::Subject.new
  subject.select {|pkt| target_dash_pushed?(pkt) }.debounce(INTERVAL_SECONDS).subscribe(
    lambda {|pkt| post_to_slack },
    lambda {|err| puts "Error: #{err}" },
    lambda { puts 'Completed.' }
  )

  cap = Capture.new(iface: iface, filter: FILTER, start: true)
  cap.stream.each do |pkt|
    subject.on_next pkt
  end
end

def target_dash_pushed?(pkt)
  return false unless EthPacket.can_parse?(pkt)
  EthHeader.str2mac(EthPacket.parse(pkt).eth_src) == MAC_OF_DASH
end

def post_to_slack
  api_url = SLACK_API_URL
  payload = {
    channel:    '#akanuma_private',
    username:   'dash',
    icon_emoji: ':squirrel:',
    text:       'Hello World from Dash Button!!'
  }
  command = "curl -X POST --data-urlencode 'payload=#{payload.to_json}' #{api_url}"
  puts command
  output, std_error, status = Open3.capture3(command)
  puts output
  puts std_error
  puts status

  t_stamp = Time.now.strftime("%Y-%m-%d %H:%M:%S.%6N")
  puts "#{t_stamp} Posted to Slack."
end

if $0 == __FILE__
  iface = ARGV[0]
  puts "Capturing for interface: #{iface}"
  get_capture(iface)
end

 キャプチャしたパケットをRxRubyで作ったストリームに放り込み、selectでターゲットのダッシュボタンからのパケットのみフィルタリングしています。そして debounce で指定した時間(今回は2秒間)よりも短い間隔のパケットをフィルターしています。前回のコードだと最後の処理の時間を記録してその差分をチェックする部分を自前で用意していましたが、 debounce を利用することでシンプルに実装することができました。

 まだまだ Reactive Extensions は使い始めたばかりですが、うまく使えばかなりシンプルに処理を実装することができそうなので、今後使い方を身につけていきたいと思います。

Amazon Dash Button を押したら Slack にポストする

 12月5日に日本でも Amazon Dash Button の提供が始まりましたが、すぐに下記の記事を投稿されている方がいて、面白そうだったので私もやってみました。

qiita.com

f:id:akanuma-hiroaki:20161217181325j:plain:w300:left

 他にもすでに同様のことを行われている記事はあるのですが、パケットキャプチャ部分を Ruby で書いている記事は見つからなかったので、 Ruby で書いてみました。ボタンの設定は上記ページなどですでに詳しく紹介されていて、同様に行いましたのでここでは割愛します。

 ちなみに本当は AWS IoT Button を使ってみたいのですが、まだ日本では発売されていないので、ひとまず Dash Button で我慢します。

AWS IoT ボタン - AWS IoT | AWS

処理の流れ

 先ほどの記事でも紹介されていますが、 Dash Button が押された時の処理の流れは下記のようになります。

  1. 電源ON(通常時はOFFになっている)
  2. 設定されたWi-Fiネットワークに接続
  3. IP重複検知のために ARP Probe もしくは UDP Broadcast 送信
  4. Amazonへの購入処理実行
  5. 電源OFF

 試しにボタンのIPアドレスにpingしてみたところ、ボタンを押すと電源が入ってpingが返ってくるようになり、処理が終わるとまた電源がOFFになってpingが返らなくなりました。

 $ ping 192.168.10.10
PING 192.168.10.10 (192.168.10.10): 56 data bytes
Request timeout for icmp_seq 0
Request timeout for icmp_seq 1
Request timeout for icmp_seq 2
Request timeout for icmp_seq 3
ping: sendto: No route to host
Request timeout for icmp_seq 4
ping: sendto: Host is down
Request timeout for icmp_seq 5
64 bytes from 192.168.10.10: icmp_seq=0 ttl=64 time=6763.680 ms
64 bytes from 192.168.10.10: icmp_seq=1 ttl=64 time=5758.602 ms
64 bytes from 192.168.10.10: icmp_seq=2 ttl=64 time=4753.781 ms
64 bytes from 192.168.10.10: icmp_seq=3 ttl=64 time=3752.679 ms
64 bytes from 192.168.10.10: icmp_seq=4 ttl=64 time=2749.437 ms
64 bytes from 192.168.10.10: icmp_seq=7 ttl=64 time=4.412 ms
64 bytes from 192.168.10.10: icmp_seq=8 ttl=64 time=6.484 ms
64 bytes from 192.168.10.10: icmp_seq=9 ttl=64 time=2.491 ms
64 bytes from 192.168.10.10: icmp_seq=10 ttl=64 time=3.172 ms
Request timeout for icmp_seq 15
Request timeout for icmp_seq 16
Request timeout for icmp_seq 17
Request timeout for icmp_seq 18

 Dash Button では AWS IoT Button のような設定の自由度はなく、購入処理のための通信を検知して処理を行う必要があります。そこで大きく分けて下記2つの内容を実装します。

  1. Dash Button の ARP Probe もしくは UDP Broadcast をキャプチャしてMACアドレスを確認する

  2. Dash Button のMACアドレスからの通信を検知したら目的の処理を行う

Dash Button のMACアドレス確認

 Ruby でのパケットキャプチャ用ライブラリを探したところ、 PacketFu というライブラリがあったのでこちらを使用してみます。

github.com

 実装コードは下記の通りです。

capture.rb

require 'packetfu'
require './ouis.rb'
include PacketFu

def get_capture(iface)
  cap = Capture.new(iface: iface, start: true)
  cap.stream.each do |pkt|
    time = Time.now.strftime("%Y-%m-%d %H:%M:%S.%6N")

    if UDPPacket.can_parse?(pkt)
      udp_packet = UDPPacket.parse(pkt)
      src_ip = IPHeader.octet_array(udp_packet.ip_src).join('.')
      dst_ip = IPHeader.octet_array(udp_packet.ip_dst).join('.')
      src_port = udp_packet.udp_src
      dst_port = udp_packet.udp_dst
      src_mac, dst_mac, vendor_name = get_common_values(udp_packet)
      puts "time:#{time}, src_mac:#{src_mac}, dst_mac:#{dst_mac}, src_ip:#{src_ip}, dst_ip:#{dst_ip}, src_port:#{src_port}, dst_port:#{dst_port}, protocol:udp, vendor: #{vendor_name}"
      next
    end

    if ARPPacket.can_parse?(pkt)
      arp_packet = ARPPacket.parse(pkt)
      src_ip = arp_packet.arp_saddr_ip
      dst_ip = arp_packet.arp_daddr_ip
      src_mac, dst_mac, vendor_name = get_common_values(arp_packet)
      puts "time:#{time}, src_mac:#{src_mac}, dst_mac:#{dst_mac}, src_ip:#{src_ip}, dst_ip:#{dst_ip}, protocol:arp, vendor: #{vendor_name}"
    end
  end
end

def get_common_values(packet)
  src_mac = EthHeader.str2mac(packet.eth_src)
  dst_mac = EthHeader.str2mac(packet.eth_dst)
  vendor_name = get_vendor_name(src_mac)
  return src_mac, dst_mac, vendor_name
end

def get_vendor_name(mac)
  oui = mac.split(':').slice(0, 3).join('-')
  OUIS[oui.upcase]
end

if $0 == __FILE__
  iface = ARGV[0]
  puts "Capturing for interface: #{iface}"
  get_capture(iface)
end

 キャプチャしたパケットが ARPパケットもしくはUDPパケットであれば、パケットを解析して必要な情報を抜き出して画面に出力しています。

 また、Dash Button 以外からのパケットの情報も出力されるため、MACアドレスのベンダーコードからどのベンダーの端末からのパケットかも出すようにしています。あらかじめ IEEE のサイトからベンダーコードのリストを取得し、hash 形式で ouis.rb に保持し、 require して使っています。

IEEEのベンダーコードリスト(重いです)
http://standards.ieee.org/regauth/oui/oui_public.txt

ouis.rb

# http://standards.ieee.org/regauth/oui/oui_public.txt をもとに作成
OUIS = {
  'E0-43-DB' => "Shenzhen ViewAt Technology Co.,Ltd. ",
  '24-05-F5' => "Integrated Device Technology (Malaysia) Sdn. Bhd.",
  '2C-30-33' => "NETGEAR",
  '3C-D9-2B' => "Hewlett Packard",
  '9C-8E-99' => "Hewlett Packard",
  'B4-99-BA' => "Hewlett Packard",
  '1C-C1-DE' => "Hewlett Packard",
  '3C-35-56' => "Cognitec Systems GmbH",
〜〜〜以下略〜〜〜

 そしてスクリプトを実行して Dash Button を押すと下記のような出力が確認できました。

$ sudo ruby capture.rb en0 | grep -i amazon
/Users/akanuma/workspace/dash_button/ouis.rb:8296: warning: key "00-01-C8" is duplicated and overwritten on line 8309
/Users/akanuma/workspace/dash_button/ouis.rb:12779: warning: key "08-00-30" is duplicated and overwritten on line 17381
/Users/akanuma/workspace/dash_button/ouis.rb:12779: warning: key "08-00-30" is duplicated and overwritten on line 22049
time:2016-12-17 20:52:06.677957, src_mac:88:71:e5:f0:89:71, dst_mac:ff:ff:ff:ff:ff:ff, src_ip:0.0.0.0, dst_ip:255.255.255.255, src_port:68, dst_port:67, protocol:udp, vendor: Amazon Technologies Inc.
time:2016-12-17 20:52:06.689735, src_mac:88:71:e5:f0:89:71, dst_mac:ff:ff:ff:ff:ff:ff, src_ip:192.168.10.10, dst_ip:192.168.10.1, protocol:arp, vendor: Amazon Technologies Inc.

 ベンダーコードのリストで同一のベンダーコードが微妙に異なるベンダー名表記で複数回登録されているために warning が出ていますが、処理には影響ないので今回は無視します。ベンダー名が Amazon Technologies Inc. となっているのが Dash Button です。 src_mac として出力している内容が Dash Button のMACアドレスになりますので、このMACアドレスからの通信を検知して処理を行うスクリプトを実装します。

Dash Button からの通信を検知して Slack に投稿する

 通信を検知するための処理は基本的にMACアドレスを確認するためのスクリプトと同様になります。パケットの送信元MACアドレスが Dash Button のものだったらSlackに投稿する処理を実行します。

post_to_slack.rb

require 'packetfu'
require 'open3'
require 'json'
include PacketFu

FILTER = nil
MAC_OF_DASH = '88:71:e5:f0:89:71'
SLACK_API_URL = 'Slack の Incoming Webhook URL'
INTERVAL_MICRO_SECONDS = 2_000_000

@last_processed_time = 0

def get_capture(iface)
  cap = Capture.new(iface: iface, filter: FILTER, start: true)
  cap.stream.each do |pkt|
    next if !ARPPacket.can_parse?(pkt) && !UDPPacket.can_parse?(pkt)

    packet = Packet.parse(pkt)
    next if EthHeader.str2mac(packet.eth_src) != MAC_OF_DASH
    next if !past_since_last_processed?

    post_to_slack
    @last_processed_time = current_unixtime_with_micro_seconds

    t_stamp = Time.now.strftime("%Y-%m-%d %H:%M:%S.%6N")
    puts "#{t_stamp} Posted to Slack."
  end
end

def current_unixtime_with_micro_seconds
  now = Time.now
  "#{now.to_i}#{now.usec}".to_i
end

def past_since_last_processed?
  current_unixtime_with_micro_seconds - @last_processed_time >= INTERVAL_MICRO_SECONDS
end

def post_to_slack
  api_url = SLACK_API_URL
  payload = {
    channel:    '#akanuma_private',
    username:   'dash',
    icon_emoji: ':squirrel:',
    text:       'Hello World from Dash Button!!'
  }
  command = "curl -X POST --data-urlencode 'payload=#{payload.to_json}' #{api_url}"
  puts command
  output, std_error, status = Open3.capture3(command)
  puts output
  puts std_error
  puts status
end

if $0 == __FILE__
  iface = ARGV[0]
  puts "Capturing for interface: #{iface}"
  get_capture(iface)
end

 色々試してみたところ、 自宅ではボタンを押すと ARP と UDP のパケットが一度ずつ飛ぶのですが、会社のネットワークで試すと ARP や UDP のパケットが飛ぶタイミングを特定しきれず、ボタンを押した時に ARP が飛んだり飛ばなかったり、 UDP が複数回飛んだりするので、とりあえずの策として、ARPとUDP両方を検知して、前回の実行から2,000,000マイクロ秒(2秒)以内だったら実行しないようにしました。他の方の記事ではあまり回数がブレるというのはなさそうに見えるので、もう少し調べてみたいところです。この辺り詳しい方いたら教えていただけると嬉しいです。

 Slackへの投稿は Open3 を使って Incoming Webhook のURLにポストしているだけのシンプルな内容です。これを実行すると下記のようにSlackに投稿されます。

f:id:akanuma-hiroaki:20161217212950p:plain

 今回はSlackに投稿しましたが、この内容さえ変えればボタンが押された時の処理は自由に変更できるので、アイディア次第で色々面白いことができそうに思っています。社内で使うちょっとしたツールなど色々試してみたいと思います。

LAN内にサーバが必要

 今回はとりあえず動かしてみたということで、自分のMac上でスクリプトを動かしましたが、常時使うためのツールを作るのであれば、LAN内にサーバを用意する必要があります。これが AWS IoT Button であれば直接AWSのサービスと連携できると思うので、早く日本でも使えるようになってほしいですね。

Vagrant で稼働させたVM上で Dash Button のパケットをキャプチャできなかった

 今回試す環境を最初は Vagrant でパブリックネットワーク設定のVMを作ってVM上で動かしていたのですが、VM上では Dash Button からのパケットが検知できませんでした。たまに検知できるときもあるんですが、検知できない場合が多いです。ただ、 冒頭で紹介した記事で紹介されている node.js でのやり方だとちゃんと検知できていますし、 tcpdump でパケットを見てみると、Macのローカル上でもVM上でも同様に検知できているので、PacketFuで解析している部分が何か違うのかなと思い色々調べてみましたが、特定できませんでした。VM上へはMacのネットワークインタフェースを経由して到達していると思うので、経由したIFの情報を送信元として認識しているような感じではあるのですが、この辺りも何かわかる方いたら情報いただけると嬉しいです。

今回のコード

今回のコードはこちらに公開しました。

github.com

最尤推定による回帰分析のコード

 今回は「ITエンジニアのための機械学習理論入門」の最尤推定による回帰分析のサンプルコードを ruby で実装してみます。書籍のサンプルコードは下記に公開されています。

github.com

自然対数

 今回は前回までのコードと似ている部分が多く、新しい要素は自然対数のみで、python では自然対数を求めるために numpy.log を使います。

numpy.log
https://docs.scipy.org/doc/numpy/reference/generated/numpy.log.html

 ruby では Math.log メソッドを使います。

Math.log
https://docs.ruby-lang.org/ja/latest/method/Math/m/log.html

サンプルスクリプト全体

 ruby でのコード全体としては下記のように実装しました。

require 'daru'
require 'nyaplot'

N = 10
M = [0, 1, 3, 9]

def normal_rand(mu = 0, sigma = 1.0)
  random = Random.new
  (Math.sqrt(-2 * Math.log(random.rand)) * Math.sin(2 * Math::PI * random.rand) * sigma) + mu
end


def create_dataset(num)
  dataset = Daru::DataFrame.new({'x': [], 'y': []})  

  num.times do |i|
    x = i.to_f / (num - 1).to_f
    y = Math.sin(2 * Math::PI * x) + normal_rand(0, 0.3)
    dataset.add_row(Daru::Vector.new([x, y], index: [:x, :y]))
  end
  
  return dataset
end

def log_likelihood(dataset, f)
  dev = 0.0
  n = dataset.size.to_f
  dataset.each_row do |line|
    x = line.x
    y = line.y
    dev += (y - f.call(x))**2
  end
  err = dev * 0.5
  beta = n / dev
  -beta * err + 0.5 * n * Math.log(0.5 * beta / Math::PI)
end

def resolve(dataset, m)
  t = dataset.y

  columns = {}
  (m+1).times do |i|
    columns["x**#{i}"] = dataset.x ** i
  end
  phi = Daru::DataFrame.new(columns)

  tmp = (phi.transpose.to_matrix * phi.to_matrix).inv
  ws = (tmp * phi.transpose.to_matrix) * Vector.elements(t.to_a)

  f = lambda {|x|
    y = 0
    ws.each_with_index do |w, i|
      y += w * (x ** i)
    end

    y
  }

  sigma2 = 0.0
  dataset.each_row do |line|
    sigma2 += (f.call(line.x) - line.y)**2
  end
  sigma2 /= dataset.size

  return f, ws, Math.sqrt(sigma2)
end

train_set = create_dataset(N)
test_set = create_dataset(N)
df_ws = {}

fig = Nyaplot::Frame.new

M.each_with_index do |m, c|
  f, ws, sigma = resolve(train_set, m)
  df_ws["M=#{m}"] = Daru::Vector.new(ws, name: "M=#{m}")
  
  plot = Nyaplot::Plot.new
  sc = plot.add_with_df(train_set.to_nyaplotdf, :scatter, :x, :y)
  sc.title("train_set")
  sc.color('blue')
  
  linex = (0..1).step(1.0 / (101 - 1)).to_a
  liney = linex.map do |x|
    Math.sin(2 * Math::PI * x)
  end
  line_answer = plot.add(:line, linex, liney)
  line_answer.title('answer')
  line_answer.color('green')
  
  liney = linex.map do |x|
    f.call(x)
  end
  line_middle = plot.add(:line, linex, liney)
  line_middle.title("Sigma=#{sprintf("%.2f", sigma)}")
  line_middle.color('red')
  line_upper = plot.add(:line, linex, liney.map {|y| y + sigma })
  line_upper.color('red')
  line_lower = plot.add(:line, linex, liney.map {|y| y - sigma } )
  line_lower.color('red')

  plot.configure do
    x_label("M=#{m}")
    y_label('')
    xrange([-0.05, 1.05])
    yrange([-1.5, 1.5])
    legend(true)
    height(300)
    width(490)
  end
  
  fig.add(plot)
end

fig.show

df = Daru::DataFrame.new({m: [], 'Test set': [], 'Training set': []})  
9.times do |m|
  f, ws, sigma = resolve(train_set, m)
  train_mlh = log_likelihood(train_set, f)
  test_mlh = log_likelihood(test_set, f)
  df.add_row(Daru::Vector.new([m, test_mlh, train_mlh], index: [:m, 'Test set'.to_sym, 'Training set'.to_sym]))
end

df.plot(type: [:line, :line], x: [:m, :m], y: ['Test set'.to_sym, 'Training set'.to_sym]) do |plot, diagrams|
  test_set_diagram = diagrams[0]
  train_set_diagram = diagrams[1]
  
  train_set_diagram.title('Training set')
  train_set_diagram.color('blue')
  test_set_diagram.title('Test set')
  test_set_diagram.color('green')
  
  plot.x_label("Log likelihood for N=#{N}")
  plot.y_label('')
  plot.legend(true)
end

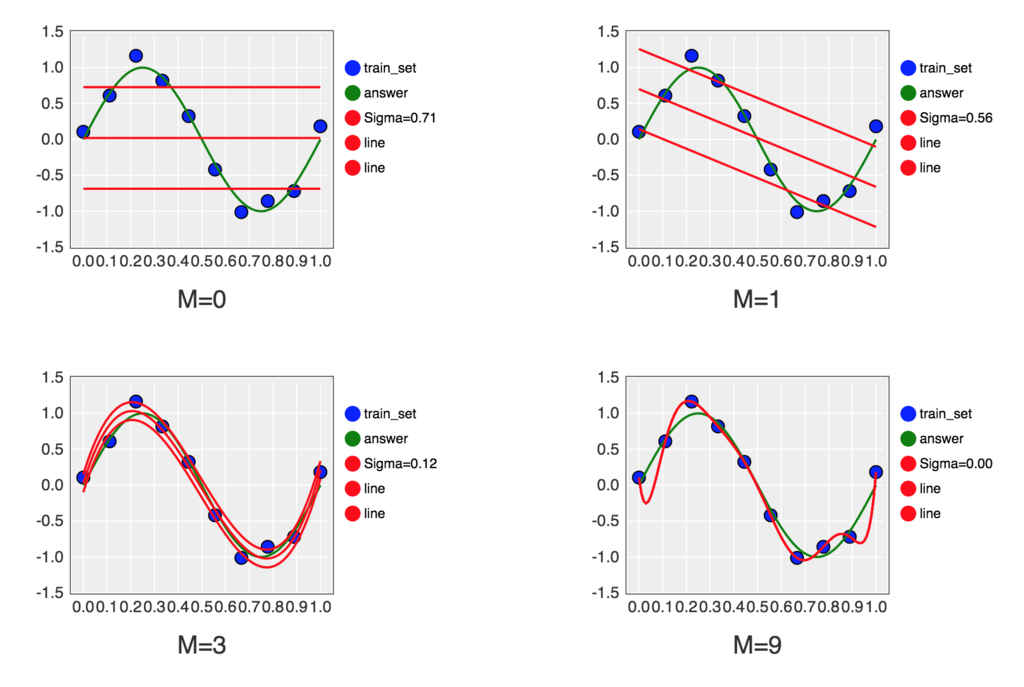
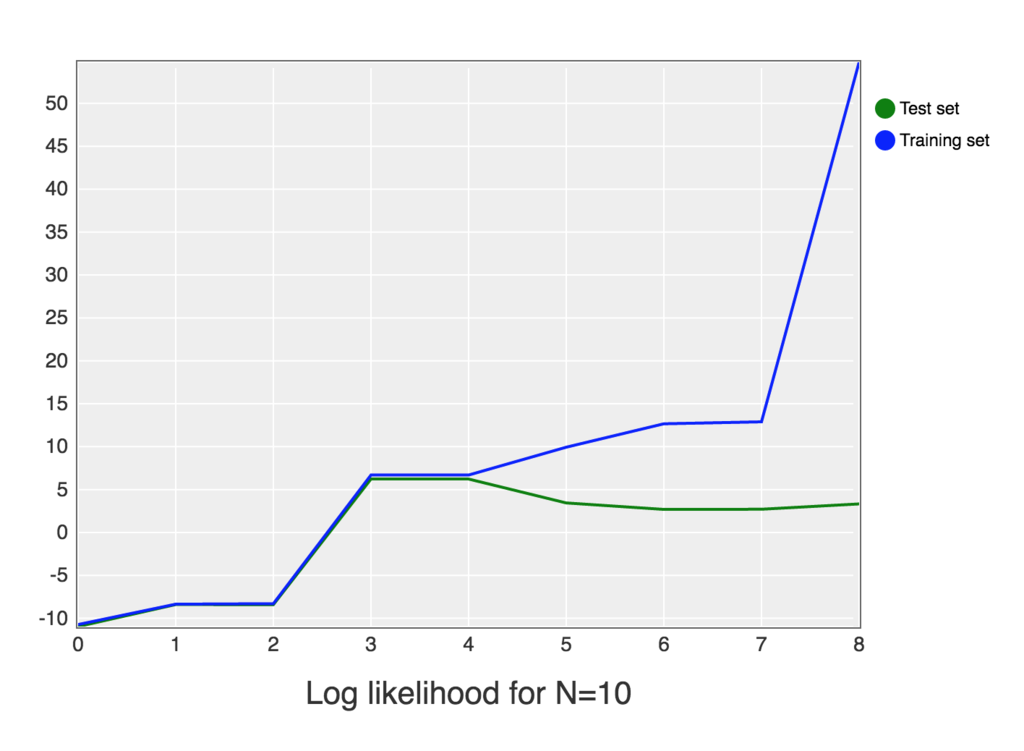
 これを jupyter notebook 上で実行すると下記のようなグラフが描画されます。

f:id:akanuma-hiroaki:20161214060609p:plain

f:id:akanuma-hiroaki:20161214060626p:plain

 Jupyter Notebook 上での実行結果は下記に公開してあります。

http://nbviewer.jupyter.org/github/h-akanuma/ml4se_study/blob/master/03-maximum_likelihood.ipynb

github.com

最小二乗法による分析結果のグラフ表示コード

 今回は前回までのメソッドを使って分析した結果をグラフに表示する部分のコードを ruby で実装します。書籍のコードの下記の部分になります。

# Main
if __name__ == '__main__':
    train_set = create_dataset(N)
    test_set = create_dataset(N)
    df_ws = DataFrame()

    # 多項式近似の曲線を求めて表示
    fig = plt.figure()
    for c, m in enumerate(M):
        f, ws = resolve(train_set, m)
        df_ws = df_ws.append(Series(ws,name="M=%d" % m))

        subplot = fig.add_subplot(2,2,c+1)
        subplot.set_xlim(-0.05,1.05)
        subplot.set_ylim(-1.5,1.5)
        subplot.set_title("M=%d" % m)

        # トレーニングセットを表示
        subplot.scatter(train_set.x, train_set.y, marker='o', color='blue')

        # 真の曲線を表示
        linex = np.linspace(0,1,101)
        liney = np.sin(2*np.pi*linex)
        subplot.plot(linex, liney, color='green', linestyle='--')

        # 多項式近似の曲線を表示
        linex = np.linspace(0,1,101)
        liney = f(linex)
        label = "E(RMS)=%.2f" % rms_error(train_set, f)
        subplot.plot(linex, liney, color='red', label=label)
        subplot.legend(loc=1)

    # 係数の値を表示
    print "Table of the coefficients"
    print df_ws.transpose()
    fig.show()

    # トレーニングセットとテストセットでの誤差の変化を表示
    df = DataFrame(columns=['Training set','Test set'])
    for m in range(0,10):   # 多項式の次数
        f, ws = resolve(train_set, m)
        train_error = rms_error(train_set, f)
        test_error = rms_error(test_set, f)
        df = df.append(
                Series([train_error, test_error],
                    index=['Training set','Test set']),
                ignore_index=True)
    df.plot(title='RMS Error', style=['-','--'], grid=True, ylim=(0,0.9))
    plt.show()

 引用元のサンプルスクリプトの全体は下記で公開されています。

github.com

iruby環境の用意

 書籍では python コードの実行環境として ipython を使用していますが、その ruby 版にあたる iruby を使用します。

github.com

 書籍の例ではGUI上のターミナルから ipython を起動し、pythonのコードを実行すると別ウィンドウでグラフが表示されるのですが、 iruby では同様なことの実現方法がわからなかったので、 jupyter notebook 上で iruby を使用します。

jupyter.org

Vagrantfile

 Anaconda でインストールされる ipython のバージョンは4だったのですが、iruby が対応してるのは ipython3 のようだったので、 Vagrantfile に下記を追加し、ipython のバージョンを下げます。

config.vm.provision :shell, path: "provisionings/condas.sh"

provisionings/condas.sh

#!/bin/bash

conda install ipython=3.2.3 -y

provisionings/libs.sh

 jupyter notebook を起動してVM上のブラウザからアクセスするために、Chrome をインストールします。下記を追加して Chrome のリポジトリを追加し、 yum でインストールします。

cat <<'EOF' > /etc/yum.repos.d/google-chrome.repo
[google-chrome]
name=google-chrome
baseurl=http://dl.google.com/linux/chrome/rpm/stable/$basearch
enabled=1
gpgcheck=1
gpgkey=https://dl-ssl.google.com/linux/linux_signing_key.pub
EOF

yum install -y google-chrome-stable

provisionings/gems.sh

 python 版ではグラフのプロットのために matplotlib を使用していますが、 ruby 版では iruby 上で使用できる nyaplot を使います。

github.com

 下記を追記して、 nyaplot をインストールします。

gem install nyaplot

Nyaplot でのグラフ描画

 次数が 0, 1, 3, 9 の4種類の多項式のグラフを扱うので、まず複数の図を一まとめで扱うための Nyaplot::Frame のインスタンスを作成します。

fig = Nyaplot::Frame.new

 それぞれの図を作成するには、まず Nyaplot::Plot のインスタンスを生成し、そこに Nyaplot::DataFrame のオブジェクトを渡すことで作成できます。

Nyaplot::Plot#add_with_df
http://www.rubydoc.info/github/domitry/nyaplot/master/Nyaplot%2FPlot%3Aadd_with_df

 戻り値のオブジェクトに対して凡例のタイトルやグラフの色の指定をすることができます。

  plot = Nyaplot::Plot.new
  sc = plot.add_with_df(train_set.to_nyaplotdf, :scatter, :x, :y)
  sc.title("train_set")
  sc.color('blue')

 Nyaplot::Plot のインスタンスに配列データを渡すことでもグラフを作成できます。

Nyaplot::Plot#add
http://www.rubydoc.info/github/domitry/nyaplot/master/Nyaplot%2FPlot%3Aadd

 また、python版では numpy.linspace を使って、あるレンジ内で指定した数の数値を等間隔で取得していますが、 ruby では同様のメソッドが見つからなかったので、 step メソッドで代用しました。

  linex = (0..1).step(1.0 / (101 - 1)).to_a
  liney = linex.map do |x|
    Math.sin(2 * Math::PI * x)
  end
  line_answer = plot.add(:line, linex, liney)
  line_answer.title('answer')
  line_answer.color('green')

 図自体の大きさやメモリの範囲を指定するには、 plot.configure にブロックを渡して各値を設定します。

  plot.configure do
    x_label("M=#{m}")
    y_label('')
    xrange([-0.05, 1.05])
    yrange([-1.5, 1.5])
    legend(true)
    height(300)
    width(490)
  end

 最後に Nyaplot::Frame インスタンスに図のオブジェクトを追加します。

  fig.add(plot)

 Daru::DataFrame の内容をテキストで見やすい形に整形して表示するには、 Daru::DataFrame#inspect を使います。

Daru::DataFrame#inspect
http://www.rubydoc.info/gems/daru/0.1.0/Daru%2FDataFrame%3Ainspect

puts 'Table ot the coefficients'
puts Daru::DataFrame.new(df_ws).inspect

 出力は下記のようになります。

Table ot the coefficients
#<Daru::DataFrame(10x4)>
                   M=0        M=1        M=3        M=9
          0 0.05554492 0.80497528 -0.0362814 0.08278865
          1        nil -1.4988607 11.7919126 -24.851479
          2        nil        nil -34.392490 657.588025
          3        nil        nil 22.6689535 -5930.9070
          4        nil        nil        nil 29069.5535
          5        nil        nil        nil -84750.916
          6        nil        nil        nil 148809.822
          7        nil        nil        nil -153632.58
          8        nil        nil        nil 85727.3726
          9        nil        nil        nil -19925.297

 Nyaplot::Frame#show を実行することで図が描画されます。

fig.show

 また、Daru は Nyaplot でのプロットに対応しているので、一つの Daru::DataFrame オブジェクトの内容をプロットするだけであれば、 Daru::DataFrame#plot を使うことで描画可能です。

Daru::DataFrame#plot
http://www.rubydoc.info/gems/daru/0.1.0/Daru%2FPlotting%2FDataFrame%3Aplot

df.plot(type: [:line, :line], x: [:m, :m], y: ['Training set'.to_sym, 'Test set'.to_sym]) do |plot, diagrams|
  train_set_diagram = diagrams[0]
  test_set_diagram = diagrams[1]
  
  train_set_diagram.title('Training set')
  train_set_diagram.color('blue')
  test_set_diagram.title('Test set')
  test_set_diagram.color('green')
  
  plot.x_label('M')
  plot.y_label('RMS Error')
  plot.yrange([0, 0.9])
  plot.legend(true)
end

 ここまでの内容を踏まえたコードの全体を下記のように実装しました。

train_set = create_dataset(N)
test_set = create_dataset(N)
df_ws = {}

fig = Nyaplot::Frame.new

M.each_with_index do |m, c|
  f, ws = resolve(train_set, m)
  df_ws["M=#{m}"] = Daru::Vector.new(ws, name: "M=#{m}")
  
  plot = Nyaplot::Plot.new
  sc = plot.add_with_df(train_set.to_nyaplotdf, :scatter, :x, :y)
  sc.title("train_set")
  sc.color('blue')
  
  linex = (0..1).step(1.0 / (101 - 1)).to_a
  liney = linex.map do |x|
    Math.sin(2 * Math::PI * x)
  end
  line_answer = plot.add(:line, linex, liney)
  line_answer.title('answer')
  line_answer.color('green')
  
  liney = linex.map do |x|
    f.call(x)
  end
  line_erms = plot.add(:line, linex, liney)
  line_erms.title("E(RMS#{sprintf("%.2f", rms_error(train_set, f))})")
  line_erms.color('red')

  plot.configure do
    x_label("M=#{m}")
    y_label('')
    xrange([-0.05, 1.05])
    yrange([-1.5, 1.5])
    legend(true)
    height(300)
    width(490)
  end
  
  fig.add(plot)
end

puts 'Table ot the coefficients'
puts Daru::DataFrame.new(df_ws).inspect

fig.show

df = Daru::DataFrame.new({m: [], 'Training set': [], 'Test set': []})  
10.times do |m|
  f, ws = resolve(train_set, m)
  train_error = rms_error(train_set, f)
  test_error = rms_error(test_set, f)
  df.add_row(Daru::Vector.new([m, train_error, test_error], index: [:m, 'Training set'.to_sym, 'Test set'.to_sym]))
end

df.plot(type: [:line, :line], x: [:m, :m], y: ['Training set'.to_sym, 'Test set'.to_sym]) do |plot, diagrams|
  train_set_diagram = diagrams[0]
  test_set_diagram = diagrams[1]
  
  train_set_diagram.title('Training set')
  train_set_diagram.color('blue')
  test_set_diagram.title('Test set')
  test_set_diagram.color('green')
  
  plot.x_label('M')
  plot.y_label('RMS Error')
  plot.yrange([0, 0.9])
  plot.legend(true)
end

 Jupyter Notebook 上で実行すると下記のようなグラフが描画されます。

f:id:akanuma-hiroaki:20161205085255p:plain

f:id:akanuma-hiroaki:20161205085315p:plain

 Jupyter Notebook 上での実行結果は下記に公開しました。

http://nbviewer.jupyter.org/github/h-akanuma/ml4se_study/blob/master/02-square_error.ipynb

 また、実装の全体のコードやVagrantfile等も含めてgithubに公開してあります。

github.com

平方根平均二乗誤差の計算部分のコード

 今回も引き続き書籍のサンプルコードを ruby で実装します。今回は平方根平均二乗誤差を計算するメソッドです。サンプルコードのうちの下記部分になります。渡された多項式で平方根平均二乗誤差を計算しています。

# 平方根平均二乗誤差(Root mean square error)を計算
def rms_error(dataset, f):
    err = 0.0
    for index, line in dataset.iterrows():
        x, y = line.x, line.y
        err += 0.5 * (y - f(x))**2
    return np.sqrt(2 * err / len(dataset))

 引用元のサンプルスクリプトの全体は下記で公開されています。

github.com

行列データのイテレーション

 python では pandas.DataFrame.iterrows() でデータセットをイテレーションして処理しています。

http://pandas.pydata.org/pandas-docs/stable/generated/pandas.DataFrame.iterrows.html

    err = 0.0
    for index, line in dataset.iterrows():
        x, y = line.x, line.y
        err += 0.5 * (y - f(x))**2

 ruby では Daru::DataFrame#each_row_with_index が該当します。

http://www.rubydoc.info/gems/daru/0.1.0/Daru%2FDataFrame%3Aeach_row_with_index

 今回は index は使用されていないので、 Daru::DataFrame.each_row を使います。

http://www.rubydoc.info/gems/daru/0.1.0/Daru%2FDataFrame%3Aeach_row

  err = 0.0
  dataset.each_row do |line|
    err += 0.5 * (line.y - f.call(line.x))**2
  end

行列データの行数取得

 python では len() でデータセットの行数を取得できます。

>>> dataset          
          x         y
0  0.000000 -0.054637
1  0.111111  0.368772
2  0.222222  0.928976
3  0.333333  0.363668
4  0.444444  0.024165
5  0.555556 -0.521905
6  0.666667 -0.830954
7  0.777778 -0.464237
8  0.888889  0.058286
9  1.000000  0.183302
>>>                  
>>> len(dataset)     
10                   

 ruby では Daru::DataFrame#size で行数を取得できます。

http://www.rubydoc.info/gems/daru/0.1.0/Daru%2FDataFrame%3Asize

irb(main):018:0* dataset
=> #<Daru::DataFrame(10x2)>
                     x          y
          0        0.0 -0.5455317
          1 0.11111111 0.86331945
          2 0.22222222 1.00393856
          3 0.33333333 0.82127838
          4 0.44444444 0.49240164
          5 0.55555555 -0.0866971
          6 0.66666666 -0.2723084
          7 0.77777777 -0.9982033
          8 0.88888888 -0.3344831
          9        1.0 -0.2558949
irb(main):019:0> 
irb(main):020:0* dataset.size
=> 10

 普通の配列であれば #size でも #count でも基本的には同じ結果になりますが、 Daru::DataFrame のオブジェクトで #count を使うとそれぞれの列のnullではない値の行数を返してくれます。

http://www.rubydoc.info/gems/daru/0.1.0/Daru%2FMaths%2FStatistics%2FDataFrame%3Acount

irb(main):027:0* dataset.count
=> #<Daru::Vector(2)>
       count
     x    10
     y    10

平方根

 python では numpy.sqrt で平方根を求めています。

https://docs.scipy.org/doc/numpy/reference/generated/numpy.sqrt.html

>>> np.sqrt(2)    
1.4142135623730951
>>> np.sqrt(4)    
2.0               

 ruby では Math.sqrt で平方根を求めます。

https://docs.ruby-lang.org/ja/latest/method/Math/m/sqrt.html

irb(main):029:0* Math.sqrt(2)
=> 1.4142135623730951
irb(main):030:0> Math.sqrt(4)
=> 2.0

rms_error メソッドを ruby で

 ここまでの内容を踏まえて rms_error メソッドを ruby で実装します。

def rms_error(dataset, f)
  err = 0.0
  dataset.each_row do |line|
    err += 0.5 * (line.y - f.call(line.x))**2
  end

  Math.sqrt(2 * err / dataset.size)
end

 python版とruby版それぞれの実行結果は下記のようになりました。

>>> dataset                      
          x         y            
0  0.000000 -0.380472            
1  0.111111  0.719204            
2  0.222222  0.909939            
3  0.333333  1.022670            
4  0.444444  0.254537            
5  0.555556 -0.127610            
6  0.666667 -0.557395            
7  0.777778 -0.652528            
8  0.888889 -0.436643            
9  1.000000  0.450449            
>>>                              
>>> f, ws = resolve(train_set, 3)
>>>                              
>>> rms_error(train_set, f)      
0.23852710875750457              
irb(main):012:0* train_set
=> #<Daru::DataFrame(10x2)>
                     x          y
          0        0.0 -0.1806039
          1 0.11111111 1.22769157
          2 0.22222222 1.17466241
          3 0.33333333 0.67013919
          4 0.44444444 0.61218251
          5 0.55555555 -0.3105334
          6 0.66666666 -0.7770481
          7 0.77777777 -0.8269982
          8 0.88888888 -0.3653022
          9        1.0 -0.0443871
irb(main):013:0> 
irb(main):014:0* f, ws = resolve(train_set, 3)
=> [#<Proc:0x007fb60ddd3798@/vagrant/02-square_error.rb:45 (lambda)>, Vector[0.012228114152125085, 11.30192331783317, -32.97851812391701, 21.81003531172303]]
irb(main):015:0> 
irb(main):016:0* rms_error(train_set, f)
=> 0.20727664859912284